Comparative Study
. 2009 Jan 15;182(2):1138-45.
doi: 10.4049/jimmunol.182.2.1138.

Increased reactivity of dendritic cells from aged subjects to self-antigen, the human DNA

Affiliations
Comparative Study

Increased reactivity of dendritic cells from aged subjects to self-antigen, the human DNA

Anshu Agrawal et al. J Immunol. .

Abstract

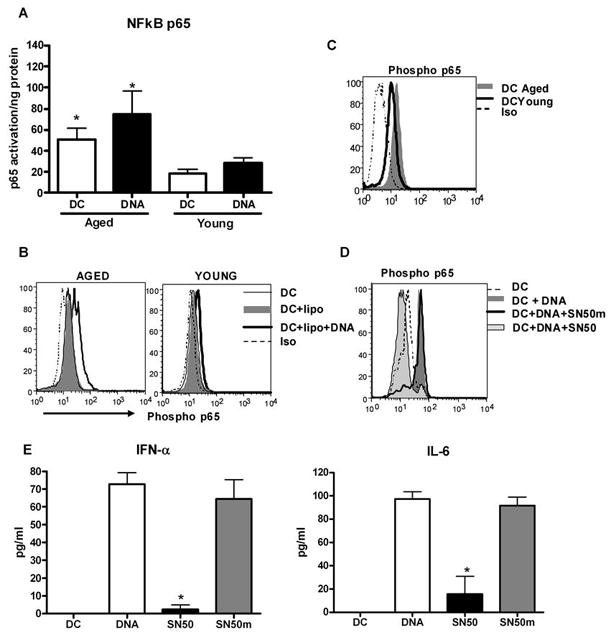
Diminished immune functions and chronic inflammation are hallmarks of aging. The underlying causes are not well understood. In this investigation, we show an increased reactivity of dendritic cells (DCs) from aged subjects to self-Ags as one of the potential mechanisms contributing to age-associated inflammation. Consistent with this, DCs from aged subjects display increased reactivity to intracellular human DNA, a self-Ag, by secreting enhanced quantities of type I IFN and IL-6 compared with the DCs from young subjects. Furthermore, this is accompanied by an increased up-regulation of costimulatory molecules CD80 and CD86. These DNA-primed DCs from aged subjects enhanced T cell proliferation compared with the young subjects, further substantiating our findings. Investigations of signaling mechanisms revealed that DNA-stimulated DCs from aged subjects displayed a significantly higher level of IFN regulatory factor-3 and NF-kappaB activity compared with their young counterparts. More importantly, DCs from aged subjects displayed a higher level of NF-kappaB activation at the basal level, suggesting an increased state of activation. This activated state of DCs may be responsible for their increased reactivity to self-Ags such as DNA, which in turn contributes to the age-associated chronic inflammation.


Figures

Figure 1
Figure 1. DCs from aged subjects display increased reactivity to intracellular human DNA compared to DCs from young subjects
A. Histograms depict the level of expression of DC activation markers on the surface of DCs from aged and young subjects after activation with human DNA. Figure is representative of six such experiments with different subjects. B. Bar diagrams show the level of IFN-α and IL-6 secreted by DCs from aged and young in response to human DNA. Figure is Mean ± S.E of fifteen different experiments. * denotes significant.
Figure 2
Figure 2. DCs from aged subjects display increased reactivity to late apoptotic cells
A. Histograms depict the level of expression of DC activation markers on the surface of DCs from aged and young subjects after activation with late apoptotic cells. B. Bar diagrams show the level of IFN-α, IL-6 and TNF-αsecreted by DCs from aged and young in response to late apoptotic cells. Figure is Mean ± S.E of four different experiments. * denotes significant.
Figure 3
Figure 3. DCs from aged subjects stimulate T cell proliferation upon activation with human DNA as compared to DCs from young
A. Titrating doses of DNA stimulated and unstimulated DCs from aged and young subjects were incubated with CFSE labeled T cells for 5days. Bar diagram depicts the percent of proliferating T cells after culture with Lipo+DNA stimulated and unstimulated DCs from aged and young subjects, as determined by dilution of CFSE dye. B. Bar diagram depicts the levels of IFN-γ secreted by T cells after co-culture with DNA stimulated and unstimulated DCs from the aged and young subjects. DC- Untreated DC alone cultured with T cells, Lipo- DC+Lipo cultured with T cells, DNA- DC+Lipo+DNA cultured with T cells and T –T cells without DC. Figure is Mean ± S.E of five different experiments. * denotes significant.
Figure 4
Figure 4. Intracellular human DNA localizes in the cytosol A
Upper panel: Left: DCs incubated with Alexa594-labeled DNA (arrow) for 3h and nucleus stained with DAPI (blue) Middle: DCs incubated with FITC conjugated LAMP-2 (green) antibody to mark the lysosomes. Right: DCs incubated with Alexa594-labeled DNA and FITC conjugated LAMP-2 (green) antibody, no co-localization observed. Lower Panel: DCs incubated with Alexa594-labeled DNA for 8h and 18h and then stained with FITC conjugated LAMP-2 (green) antibody, no co-localization observed. Figure is representative of three such experiments. B. Graph represents the ratio of DAI to GAPDH as determined by real time PCR. Figure represents the mean ± S.E. of 12 different subjects. C. Histograms denote the expression of DAI protein in aged and young subjects. Figure is representative of six such experiments.
Figure 5
Figure 5. Increased activation of IRF-3 transcription factor in DCs from aged in response to Intracellular human DNA
Bar diagram depicts the DNA binding activity of IRF-3 in DCs from aged and young at 3 hours after stimulation with intracellular human DNA. Figure is mean ± S.E. of six similar experiments. * denotes significant.
Figure 6
Figure 6. DCs from aged display a higher basal level of NFκB activation indicating an activated state
A. Nuclear extracts prepared from DCs from aged and young were assayed for p65 activity using the TransAM NFκB ELISA Kit. Figure represents mean ±S.E. of five different subjects. * denotes significant. B. Histograms denote the level of p65 phosphorylation by FACS in DCs from aged and young subjects before and after stimulation with DNA. Figure is representative of ten such experiments. C. Histogram denotes the basal level of p65 phosphorylation by FACS in DCs from aged and young subjects. Figure is representative of ten such experiments. D. Histogram denotes the phosphorylation of p65 at 3h in DNA stimulated DCs treated with SN50 inhibitor peptide or SN50m control inhibitor peptide. The peptides were dissolved in water as recommended by the manufacturer. 50μg/ml of the inhibitor or control peptide was added to DCs along with the addition of DNA+lipo complex. Figure is representative of three such experiments. E. Bar diagrams show the level of IFN-α and IL-6 secreted by human DNA stimulated DCs treated with SN50- p50 inhibitor peptide or SN50m- control peptide. Figure is Mean ± S.E of three different experiments. * denotes significant.

References

    1. Boren E, Gershwin ME. Inflamm-aging: autoimmunity, and the immune-risk phenotype. Autoimmun Rev. 2004;3:401–406. - PubMed
    1. Effros RB. Ageing and the immune system. Novartis Found Symp. 2001;235:130–139. 139–145, 146–139. - PubMed
    1. Bruunsgaard H, Pedersen BK. Age-related inflammatory cytokines and disease. Immunol Allergy Clin North Am. 2003;23:15–39. - PubMed
    1. Banchereau J, Steinman RM. Dendritic cells and the control of immunity. Nature. 1998;392:245–252. - PubMed
    1. Steinman RM, Hawiger D, Nussenzweig MC. Tolerogenic dendritic cells. Annu Rev Immunol. 2003;21:685–711. - PubMed

Publication types

MeSH terms