

Masked-Volume-Wise PCA and "reference Logan" illustrate similar regional differences in kinetic behavior in human brain PET study using [11C]-PIB
- PMID: 19126243
- PMCID: PMC2647899
- DOI: 10.1186/1471-2377-9-2
Masked-Volume-Wise PCA and "reference Logan" illustrate similar regional differences in kinetic behavior in human brain PET study using [11C]-PIB
Abstract
Background: Kinetic modeling using reference Logan is commonly used to analyze data obtained from dynamic Positron Emission Tomography (PET) studies on patients with Alzheimer's disease (AD) and healthy volunteers (HVs) using amyloid imaging agent N-methyl [11C]2-(4'-methylaminophenyl)-6-hydroxy-benzothiazole, [11C]-PIB. The aim of the present study was to explore whether results obtained using the newly introduced method, Masked Volume Wise Principal Component Analysis, MVW-PCA, were similar to the results obtained using reference Logan.
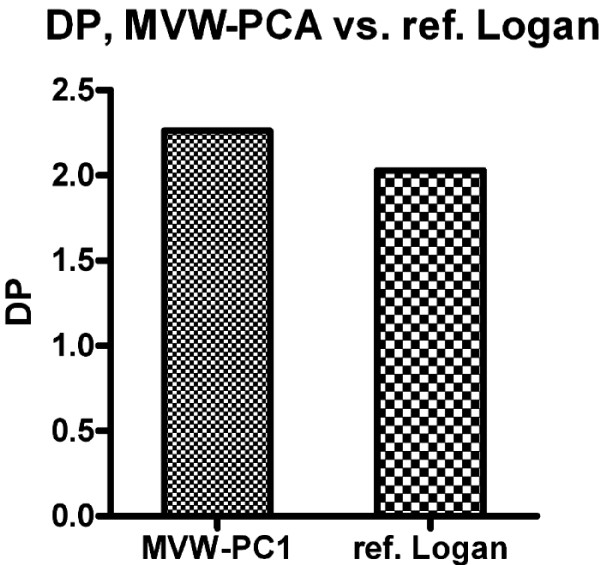
Methods: MVW-PCA and reference Logan were performed on dynamic PET images obtained from four Alzheimer's disease (AD) patients on two occasions (baseline and follow-up) and on four healthy volunteers (HVs). Regions of interest (ROIs) of similar sizes were positioned in different parts of the brain in both AD patients and HVs where the difference between AD patients and HVs is largest. Signal-to-noise ratio (SNR) and discrimination power (DP) were calculated for images generated by the different methods and the results were compared both qualitatively and quantitatively.
Results: MVW-PCA generated images that illustrated similar regional binding patterns compared to reference Logan images and with slightly higher quality, enhanced contrast, improved SNR and DP, without being based on modeling assumptions. MVW-PCA also generated additional MVW-PC images by using the whole dataset, which illustrated regions with different and uncorrelated kinetic behaviors of the administered tracer. This additional information might improve the understanding of kinetic behavior of the administered tracer.
Conclusion: MVW-PCA is a potential multivariate method that without modeling assumptions generates high quality images, which illustrated similar regional changes compared to modeling methods such as reference Logan. In addition, MVW-PCA could be used as a new technique, applicable not only on dynamic human brain studies but also on dynamic cardiac studies when using PET.
Figures


References
-
- Razifar P, Axelsson J, Schneider H, Långström B, Bengtsson E, Bergström M. A new Application of Pre-normalized Principal Component Analysis for Improvement of Image Quality and Clinical Diagnosis in Human Brain PET Studies – Clinical brain studies using [11C]-GR20 [11C]-L-deuterium-deprenyl, [11C]-5-Hydroxy-L-Tryptophan, [11C]-L-DOPA and Pittsburgh Compound-B. Neuroimage. 5171;33:588–598. doi: 10.1016/j.neuroimage.2006.05.060. - DOI - PubMed
MeSH terms
Substances
LinkOut - more resources
Full Text Sources
Other Literature Sources
Medical
