. 2009 Jan 6;7(1):e9.
doi: 10.1371/journal.pbio.1000009.

Collective cell migration drives morphogenesis of the kidney nephron

Affiliations

Collective cell migration drives morphogenesis of the kidney nephron

Aleksandr Vasilyev et al. PLoS Biol. .

Abstract

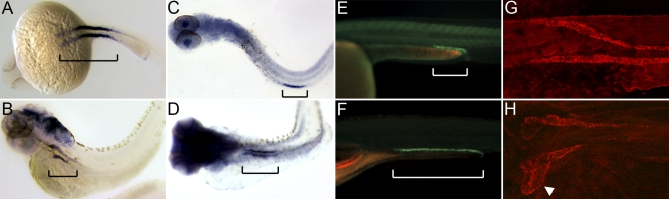
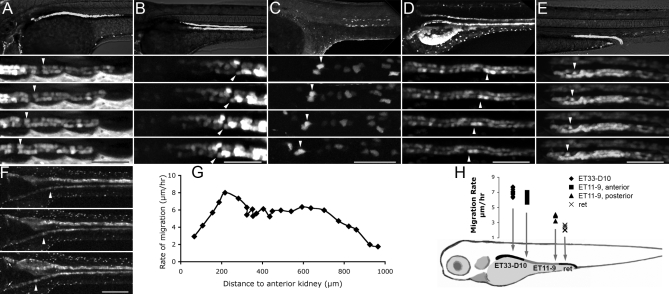
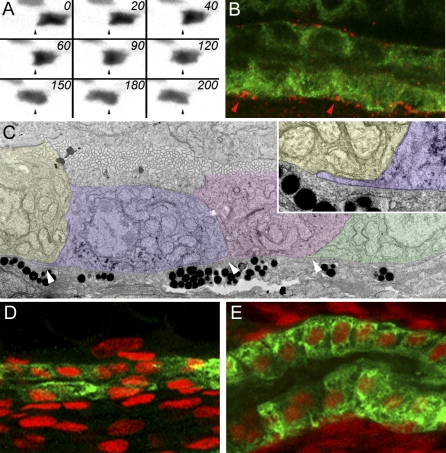
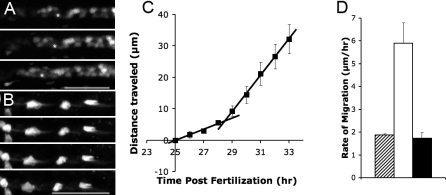
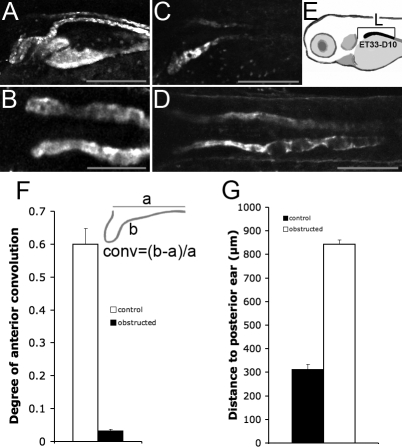
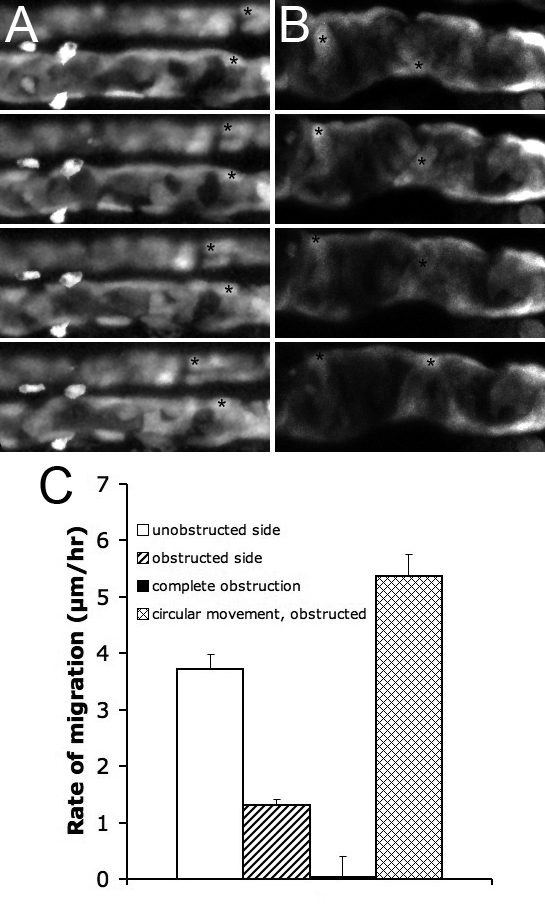
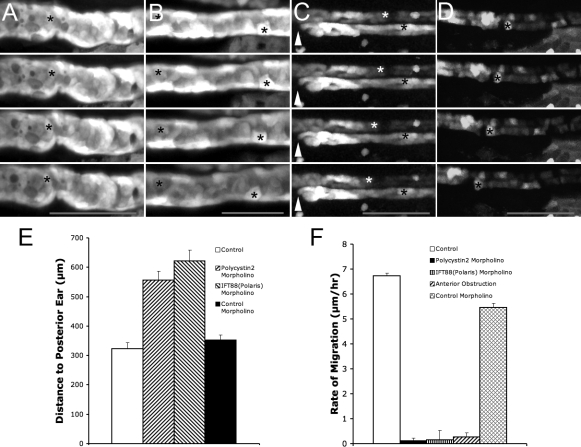
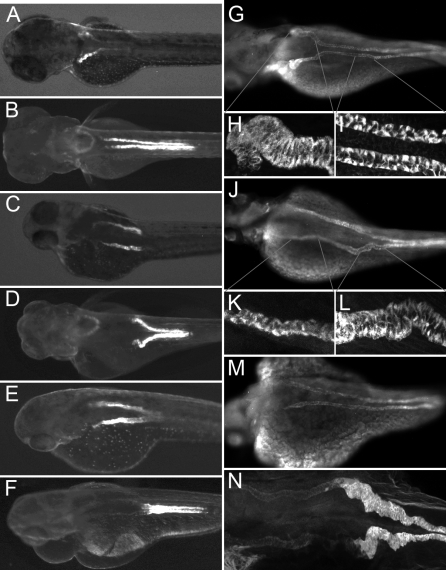
Tissue organization in epithelial organs is achieved during development by the combined processes of cell differentiation and morphogenetic cell movements. In the kidney, the nephron is the functional organ unit. Each nephron is an epithelial tubule that is subdivided into discrete segments with specific transport functions. Little is known about how nephron segments are defined or how segments acquire their distinctive morphology and cell shape. Using live, in vivo cell imaging of the forming zebrafish pronephric nephron, we found that the migration of fully differentiated epithelial cells accounts for both the final position of nephron segment boundaries and the characteristic convolution of the proximal tubule. Pronephric cells maintain adherens junctions and polarized apical brush border membranes while they migrate collectively. Individual tubule cells exhibit basal membrane protrusions in the direction of movement and appear to establish transient, phosphorylated Focal Adhesion Kinase-positive adhesions to the basement membrane. Cell migration continued in the presence of camptothecin, indicating that cell division does not drive migration. Lengthening of the nephron was, however, accompanied by an increase in tubule cell number, specifically in the most distal, ret1-positive nephron segment. The initiation of cell migration coincided with the onset of fluid flow in the pronephros. Complete blockade of pronephric fluid flow prevented cell migration and proximal nephron convolution. Selective blockade of proximal, filtration-driven fluid flow shifted the position of tubule convolution distally and revealed a role for cilia-driven fluid flow in persistent migration of distal nephron cells. We conclude that nephron morphogenesis is driven by fluid flow-dependent, collective epithelial cell migration within the confines of the tubule basement membrane. Our results establish intimate links between nephron function, fluid flow, and morphogenesis.


Conflict of interest statement

Competing interests. The authors have declared that no competing interests exist.

Figures

Figure 1
Figure 1. Proximal Displacement of Nephron Segment Boundaries and Convolution of the Proximal Nephron
(A and B) nbc1 in situ hybridization at 24 hpf (A) and at 72 hpf (B). (C and D) trpM7 in situ staining at 24 hpf (C, yolk is stripped) and at 72 hpf (D). (E and F) ret:GFP-positive domain in live zebrafish at 30 hpf (E) and at 6 dpf (F). In (A–F), brackets show the pronephric nbc1-, trpM7-, and ret-positive segments. (G and H) Immunofluorescence staining for alpha1A4 subunit of the NaK ATPase at 24 hpf (G) and at 72 hpf (H).
Figure 2
Figure 2. Pronephric Epithelial Cells Migrate toward the Glomerulus
Individual frames of confocal fluorescent time-lapse videos at 2.5-h intervals are presented for five different kidney GFP transgenics. White arrowheads in (A–F) mark individual cells at different time points in migration. (A) ET33-D10 GFP transgenic (proximal segment).(B) ET11–9 GFP transgenic (mid segment). (C) CD41:GFP transgenic, multiciliated cells, mid kidney. (D) NaK ATPase:GFP transgenic, all transporting epithelia. (E) ret1:GFP transgenic, distal collecting segment. (F) NaK ATPase:GFP transgenic. Small arrows mark the convolutions forming in the proximal tubules. (G) The rate of migration in (F) is plotted as a function of the distance from proximal-most kidney. (H) Rates of migration determined for various segments of the kidney. The upper panels in (A), (B), (D), and (E) show live GFP transgenics. The upper panel in (C) shows immunofluorescent image using anti-GFP tagged antibody. The scale bar lengths are as follows: (A), (B), (D), (E): 80 μm, (C): 60 μm, (F): 200 μm. Inter-frame time interval is 2.5 h in (A–E) and 10 h in (F). The rate of migration is measured between 2 and 2.5 dpf in (G) and between 2.5 and 3 dpf in (H).
Figure 3
Figure 3. Pronephric Epithelial Cell Migration
(A) Time-lapse images of an individual pronephric multiciliated cell in a 2.5 dpf CD41:GFP transgenic fish at 20-min intervals. Dynamic transient cytoplasmic projections are seen from the basal cell surface, most visible in frames 0 min, 60 min, and 120 min. (B) Double immunofluorescence staining of the pronephros in 3-dpf fish with anti-phospho-FAK antibody (red) and anti-alpha6 NaK ATPase (green). Phospho-FAK staining is positive at the epithelial cell interfaces along the basement membrane. (C) Transmission electron microscope images show that migrating epithelial cells send cryptic lamellipodia along the basement membrane in the direction of migration (arrowheads). Here three migrating cells are false colored to distinguish individual cells. Inset shows a single basal cytoplasmic projection. (D and E) The change in epithelial morphology of the proximal kidney (ET33-D10 GFP segment) between 36 hpf (D) and 96 hpf (E). At 36 hpf, the proximal epithelial cells are low cuboidal and the tubular diameter is small. At 96 hpf, the proximal tubule has much larger diameter and the epithelial cells become columnar. The ET33-D10 transgenic embryos were stained with anti-GFP antibody (green Alexa 488 secondary) and DAPI (red pseudocolor).
Figure 4
Figure 4. Timing of Pronephric Cell Migration
(A) NaK ATPase:GFP transgenic showing initiation of cell migration after 29 hpf. Frame interval: 4.5 hr, scale bar: 70 μm. (B) Time-lapse of the CD41:GFP transgenic 5-dpf embryo showing cessation of migration. Frame interval: 2.5 hr, scale bar: 60μm. (C) A sharp increase in the distance traveled occurs at 28.5 hpf. The two regression lines intersect at 28.5 hpf. Each point represents distance traveled by epithelial cells between 25 hpf and a given time point. The data plotted represent averages from three different embryos (D) Comparative rates of epithelial migration before 28.5 hpf (striped bar), after 28.5hpf (white bar), and after 5 dpf (black bar).
Figure 5
Figure 5. Pronephric Obstruction Prevents Convolution and Proximal Progression of the Proximal Tubule Segment
(A) The proximal tubule in NaK ATPase:GFP transgenic larvae is folded into a hairpin structure at 4 dpf. This anterior convolution is abolished in kidneys obstructed at 24 hpf (B). (C and D) The ET33-D10 GFP positive nephron segment (C) fails to progress anteriorly in 84hpf obstructed kidneys (D). (E) method of measurement. (F) Convolution was defined as the ratio of the length of the anterior portion of the pronephros in NaK ATPase:GFP transgenics minus the length of a straight line connecting the ends of this segment divided by the length of this straight line. The anterior segment was arbitrarily defined as that anterior to yolk extension (conv = (b – a)/a, as shown in the inset). The white bar is the control condition (n = 10). The black bar indicates the obstructed kidney (n = 19). Obstruction was induced at 24 hpf, measurements were performed at 96 hpf. (G) Measurement of the proximal segment progression. The black bar indicates the control nephrons (n = 13). The white bar indicates obstructed nephrons (n = 17). Obstruction was induced at 24 hpf. The measurement was performed at 84 hpf.
Figure 6
Figure 6. Pronephric Obstruction Blocks Proximal Cell Migration
(A) Unilateral obstruction, NaK ATPase:GFP, the obstructed side is shown below the control side. (B) Complete obstruction, ET11–9 GFP transgenic. The epithelial cells move circumferentially. Frame intervals in (A, B) are 2.5 h, scale bar: 70 μm. (C) Rates of migration in various conditions, from left to right: unilateral obstruction, unobstructed side (white bar); unilateral obstruction, obstructed side (striped bar); complete obstruction, rate of anterior migration (black bar); complete obstruction, rate of circumferential movement (mesh bar). Each bar represents average over a number of cells within a single experiment.
Figure 7
Figure 7. Decreasing Pronephric Fluid Flow Suppresses Anterior Migration
(A–D) Time-lapse frames of ET33-D10 GFP transgenics, 2.5 dpf. Time interval between frames is 2.5 h, scale bar: 80 μm (in bottom frame). (A) polycystin2 morphant embryo; asterisk marks stationary cell in the pronephros. (B) ift88 (polaris) morphant embryo; asterisks mark stationary cells in the pronephros. (C) Anterior (proximal) obstruction; arrowhead marks position of unilateral anterior obstruction; white asterisk marks a migrating cell in the unobstructed nephron; black asterisk marks stationary cell in the obstructed nephron. (D) Control morpholino injected embryo showing normal rate of proximal cell migration (asterisk marks a migrating cell). (E) Measurement of proximal nephron segment shortening in ET33-D10 GFP transgenics (shorter lengths indicate further proximal progression as described in Figure 5E). From left to right: Control uninjected embryos (n = 36); polycystin2 morphant embryos (n = 20); ift88 (polaris) morphant embryos (n = 10); Control morpholino injected embryos (n = 17) (F) Rates of proximal cell migration, from left to right: Control; polycystin2 morphant embryo; ift88 (polaris) morphant embryo; anterior obstruction; Control morpholino.
Figure 8
Figure 8. Eliminating Glomerular Filtration Results in Ectopic Tubule Convolution
All embryos were imaged at 84 hpf. (A and B) Control condition, ET33-D10 transgenics (A) and ET11–9 transgenics (B). (C and D) Cardiac tnnt2 morpholino injected embryos, ET33-D10 transgenic (C) and ET11–9 transgenic (D). (E and F) Cardiac tnnt2 and ift88 (polaris) morpholino injected embryos, ET33d10 transgenic (E) and ET11–9 transgenic (F). (G–M) Anti-alpha6F NaK ATPase stained embryos. (G) Control embryo. (H and I) Close-ups of the proximal and mid segments. (J) Cardiac tnnt2 morpholino injected embryo. (K and L) Close-ups of the proximal and the mid segments. (M) Cardiac tnnt2 and ift88(polaris) morpholino-injected embryo. (N) ET11–9 GFP transgenic embryo injected with cardiac tnnt2 morpholino, stained with anti-alpha6 NaK ATPase (faint), and anti-GFP (bright).

Similar articles

Cited by

References

    1. Solnica-Krezel L. Gastrulation in zebrafish – all just about adhesion. Curr Opin Genet Dev. 2006;16:433–441. - PubMed
    1. Keller R. Shaping the vertebrate body plan by polarized embryonic cell movements. Science. 2002;298:1950–1954. - PubMed
    1. Dehaan RL. Migration patterns of the precardiac mesoderm in the early chick embrvo. Exp Cell Res. 1963;29:544–560. - PubMed
    1. Lubkin SR. Branched organs: mechanics of morphogenesis by multiple mechanisms. Curr Top Dev Biol. 2008;81:249–268. - PubMed
    1. Friedl P, Hegerfeldt Y, Tusch M. Collective cell migration in morphogenesis and cancer. Int J Dev Biol. 2004;48:441–449. - PubMed

Publication types