Comparative Study
. 2009 Feb 3;48(4):754-65.
doi: 10.1021/bi8017703.

Single myosin lever arm orientation in a muscle fiber detected with photoactivatable GFP

Affiliations
Comparative Study

Single myosin lever arm orientation in a muscle fiber detected with photoactivatable GFP

Thomas P Burghardt et al. Biochemistry. .

Abstract

Myosin 2 is the molecular motor in muscle. It binds actin and executes a power stroke by rotating its lever arm through an angle of approximately 70 degrees to translate actin against resistive force. Myosin 2 has evolved to function optimally under crowded conditions where rates and equilibria of macromolecular reactions undergo major shifts relative to those measured in dilute solution. Hence, an important research objective is to detect in situ the lever arm orientation. Single-molecule measurements are preferred because they clarify ambiguities that are unavoidable with ensemble measurements; however, detecting single molecules in the condensed tissue medium where the myosin concentration exceeds 100 muM is challenging. A myosin light chain (MLC) tagged with photoactivatable green fluorescent protein (PAGFP) was constructed. The recombinant MLC physically and functionally replaced native MLC on the myosin lever arm in a permeabilized skeletal muscle fiber. Probe illumination volume was minimized using total internal reflection fluorescence microscopy, and PAGFP was sparsely photoactivated such that polarized fluorescence identified a single probe orientation. Several physiological states of the muscle fiber were characterized, revealing two distinct orientation populations in all states called straight and bent conformations. Conformation occupancy probability varies among fiber states with rigor and isometric contraction at extremes where straight and bent conformations predominate, respectively. Comparison to previous work on single rigor cross-bridges at the A-band periphery where the myosin concentration is low suggests molecular crowding in the A-band promotes occupancy of the straight myosin conformation [Burghardt, T. P., et al. (2007) Biophys. J. 93, 2226]. The latter may have a role in contraction because it provides additional free energy favoring completion of the cross-bridge power stroke.


Figures

Figure 1
Figure 1
The low molecular weight portion of an SDS/PAGE gel containing myosin. Skeletal myosin (Myo), TFP extracted native RLC and exchanged HCRCL-GFP myosin (EX), and purified HCRLC-GFP are in the gel stained with SYPRO Ruby. Gel scanning indicates exogoneous HCRLC-GFP replaces 60% of the native RLC with 1:1 stoichiometry.
Figure 2
Figure 2
Polarization anisotropy for three species: HCRLC-GFP in solution (■), HCRLC-PAGFP in solution (□), and HCRLC-GFP exchanged into full length skeletal myosin (▲) vs conditions exactly imitating those for the fiber experiments with Apo~Rigor, +ATP~Relax, +ATP+Ca~Active, +ADP~ADP, and +ATP(L)~low µ Relax. High ionic strength (H) implies addition of KPr or KCl to a final concentration of 0.5 M. Other in vitro conditions not duplicated in the fiber experiments are Apo(L) (low µ Apo) and +Ca. Apo(L) is +ATP(L) condition without ATP and +Ca implies addition of 0.1 mM CaCl2 to the Apo condition (normal or high ionic strength). Low and high ionic strength conditions correspond to ~27 and 580 mM. All other conditions have 150–160 mM ionic strength. The insert shows polarization anisotropy of HCRLC-PAGFP in Apo conditions over an excitation wavelength domain where the chromophore prior to photoactivation (un-photoactivated) and the photoactivated chromophore species absorb light (maxima at ~410 and ~488 nm, respectively). The sample giving the spectrum in the insert is mixture of photoactivated and un-photoactivated molecules.
Figure 3
Figure 3
Fluorescence under 488 nm TIR illumination for densely photoactivated HCRLC-PAGFP in an exchanged fiber. Dense photoactivation was carried out with a brief exposure to 410 nm transmitted light. The brightly fluorescing circular disk corresponds to the region exposed to the 410 nm light. The pattern of light and dark bands within the disk originates from photoactivated PAGFPs on the myosin cross-bridges in the thick filaments.
Figure 4
Figure 4
Photon counts from two different pixels as a function of time from a HCRLC-PAGFP exchanged fiber. Intense and continuous TIR illumination at 488 nm photoactivated (bottom) and photobleached (top) PAGFP. Images were accumulated at 30 sec intervals.
Figure 5
Figure 5
A HCRLC-PAGFP exchanged and sparsely photoactivated fiber in rigor under 488 nm TIR illumination for fluorescence observation of F‖,‖. Left panel: Photoactivated PAGFPs are bright spots superposed on the background fluorescence from un-photoactivated weakly fluorescing PAGFPs. Right panel: Same as in the left panel except with background removed.
Figure 6
Figure 6
P (blue) and P (red) histograms obtained by single molecule measurements from ~300 HCRLC-PAGFP tagged cross-bridges in one muscle fiber in rigor. Average polarization ratios for the histograms, <Pi>, are indicated.
Figure 7
Figure 7
Single molecule P histograms from fibers in various physiological states. Data (■) is fitted (black line) by a sum of two Gaussian distributions (red or blue lines). Individual Gaussians give an average polarization (<P>), distribution width (<(ΔP)2>)1/2, and occupation probability (p) for each fiber physiological state as summarized in Table 1.
Figure 8
Figure 8
P and P histograms interpreted in terms of probe dipole orientation. Left and right columns correspond to rigor and isometric contraction. The upper two rows compare best fitting simulated (■) with observed (solid line) P and P histograms. The bottom row shows the selections best satisfying the constraints imposed by the measured data and allowed under the F-ratio test described in METHODS for β0 (black) and σβ (red).
Figure 9
Figure 9
Best fitting selections for β0, α0, σβ, and σα with constraints from the Gaussian distributed sub-populations identified in Figure 7 by the blue and red curves. All selections are allowed under the F-ratio test described in METHODS. Top panels: Allowed selections from the lower average polarization curve with <P> ≍ 0.19 predominant in the rigor fiber. Bottom panels: Allowed selections from the higher average polarization with <P> ≍ 0.46 predominant in the isometric contracting fiber.
Figure 10
Figure 10
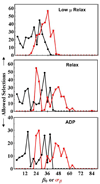
Best selections for average dipole orientation β0 (black) and distribution width σβ (red) satisfying constraints imposed by the measured P and P histograms for low µ Relax, Relax, and with ADP bound fibers. All selections allowed under the F-ratio test described in METHODS.
Scheme 1
Scheme 1

References

    1. Huxley HE. The mechanism of muscular contraction. Science. 1969;164:1356–1366. - PubMed
    1. Onishi H, Morales MF. A closer look at energy transduction in muscle. Proc. Natl. Acad. Sci. 2007;104:12714–12719. - PMC - PubMed
    1. Peyser YM, Ajtai K, Werber MM, Burghardt TP, Muhlrad A. Effect of metal cations on the conformation of myosin subfragment-1-ADP-phosphate analog complexes: A near UV circular dichroism study. Biochemistry. 1997;36:5170–5178. - PubMed
    1. Trentham DR, Eccleston JF, Bagshaw CR. Kinetic analysis of ATPase mechanisms. Quarterly Reviews of Biophysics. 1976;9:217–281. - PubMed
    1. Marston SB, Taylor EW. Comparison of the myosin and actomyosin ATPase mechanisms of the four types of vertebrate muscles. J. Mol. Biol. 1980;139:573–600. - PubMed

Publication types