. 2009 Jan 7:3:4.
doi: 10.1186/1752-0509-3-4.

Flux balance analysis of primary metabolism in Chlamydomonas reinhardtii

Affiliations

Flux balance analysis of primary metabolism in Chlamydomonas reinhardtii

Nanette R Boyle et al. BMC Syst Biol. .

Abstract

Background: Photosynthetic organisms convert atmospheric carbon dioxide into numerous metabolites along the pathways to make new biomass. Aquatic photosynthetic organisms, which fix almost half of global inorganic carbon, have great potential: as a carbon dioxide fixation method, for the economical production of chemicals, or as a source for lipids and starch which can then be converted to biofuels. To harness this potential through metabolic engineering and to maximize production, a more thorough understanding of photosynthetic metabolism must first be achieved. A model algal species, C. reinhardtii, was chosen and the metabolic network reconstructed. Intracellular fluxes were then calculated using flux balance analysis (FBA).

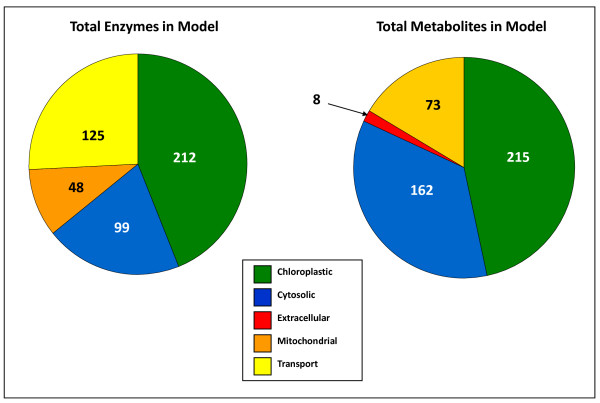
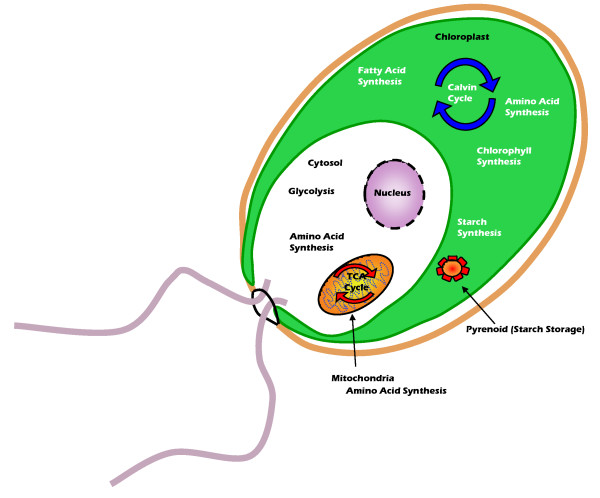
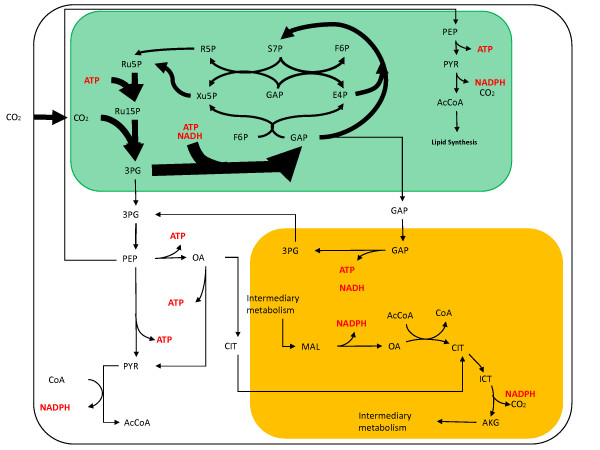
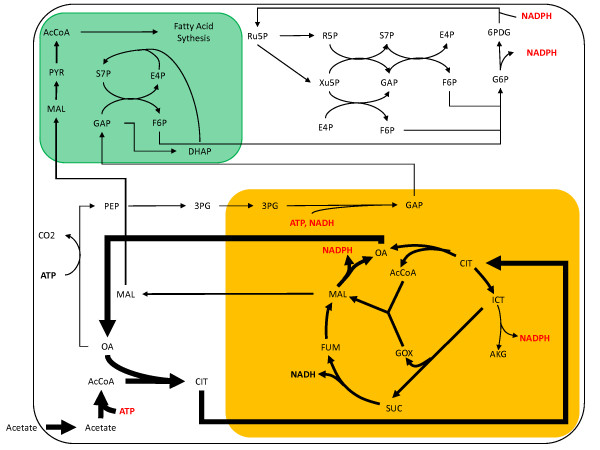
Results: The metabolic network of primary metabolism for a green alga, C. reinhardtii, was reconstructed using genomic and biochemical information. The reconstructed network accounts for the intracellular localization of enzymes to three compartments and includes 484 metabolic reactions and 458 intracellular metabolites. Based on BLAST searches, one newly annotated enzyme (fructose-1,6-bisphosphatase) was added to the Chlamydomonas reinhardtii database. FBA was used to predict metabolic fluxes under three growth conditions, autotrophic, heterotrophic and mixotrophic growth. Biomass yields ranged from 28.9 g per mole C for autotrophic growth to 15 g per mole C for heterotrophic growth.

Conclusion: The flux balance analysis model of central and intermediary metabolism in C. reinhardtii is the first such model for algae and the first model to include three metabolically active compartments. In addition to providing estimates of intracellular fluxes, metabolic reconstruction and modelling efforts also provide a comprehensive method for annotation of genome databases. As a result of our reconstruction, one new enzyme was annotated in the database and several others were found to be missing; implying new pathways or non-conserved enzymes. The use of FBA to estimate intracellular fluxes also provides flux values that can be used as a starting point for rational engineering of C. reinhardtii. From these initial estimates, it is clear that aerobic heterotrophic growth on acetate has a low yield on carbon, while mixotrophically and autotrophically grown cells are significantly more carbon efficient.


Figures

Figure 1
Figure 1
Distribution of enzymes and metabolites. Distribution of enzymes and metabolites in the reconstructed model of Chlamydomonas reinhardtii. Almost half of both the enzymes and metabolites are localized to the chloroplast, followed by the cytosol and mitochondria. There are also a large number of transport reactions, indicating the importance of metabolite exchange between compartments.
Figure 2
Figure 2
Reconstructed metabolic network of C. reinhardtii. Based on predicted target peptide sequences, the following localization of pathways was determined. Chloroplast: fatty acid synthesis, amino acid synthesis, nucleotide synthesis, starch synthesis and chlorophyll synthesis. Mitochondria: TCA cycle, amino acid synthesis. Cytosol: glycolysis, amino acid synthesis and fatty acid synthesis.
Figure 3
Figure 3
Autotrophic central metabolism flux map. The thickness of the arrows has been normalized to the total carbon dioxide uptake of 100 moles. The green compartment represents the chloroplast and the orange compartment is the mitochondria.
Figure 4
Figure 4
Heterotrophic central metabolism flux map. The thickness of the arrows has been normalized to the total acetate uptake of 100 moles. The green compartment represents the chloroplast and the orange compartment is the mitochondria.
Figure 5
Figure 5
Mixotrophic growth as a function of absorbed light. Mixotrophic growth in C. reinhardtii has two distinct regions. The first region (below 0.8 μE/m2/s) is characterized by a complete TCA cycle and inactive Rubsico. The second region (above 0.8 μE/m2/s) has an incomplete TCA cycle due to the zero flux through oxoglutarate decarboxylase and an active Rubisco.

Similar articles

Cited by

References

    1. Field CB, Behrenfeld MJ, Randerson JT, Falkowski P. Primary Production of the Biosphere: Integrating Terrestrial and Oceanic Components. Science. 1998;281:237–240. doi: 10.1126/science.281.5374.237. - DOI - PubMed
    1. Borodina I, Krabben P, Nielsen J. Genome-scale analysis of Streptomyces coelicolor A3(2) metabolism. Genome Res. 2005;15:820–829. doi: 10.1101/gr.3364705. - DOI - PMC - PubMed
    1. Famili I, Forster J, Nielsen J, Palsson BO. Saccharomyces cerevisiae phenotypes can be predicted by using constraint-based analysis of a genome-scale reconstructed metabolic network. Proc Natl Acad Sci USA. 2003;100:13134–13139. doi: 10.1073/pnas.2235812100. - DOI - PMC - PubMed
    1. Heinemann M, Kümmel A, Ruinatscha R, Panke S. In silico genome-scale reconstruction and validation of the Staphylococcus aureus metabolic network. Biotech Bioeng. 2005;92:850–864. doi: 10.1002/bit.20663. - DOI - PubMed
    1. Oliveira A, Nielsen J, Forster J. Modeling Lactococcus lactis using a genome-scale flux model. BMC Microbiology. 2005;5:39. doi: 10.1186/1471-2180-5-39. - DOI - PMC - PubMed

Publication types