. 2009 Jan 7:9:3.
doi: 10.1186/1471-2229-9-3.

A multiple-method approach reveals a declining amount of chloroplast DNA during development in Arabidopsis

Affiliations

A multiple-method approach reveals a declining amount of chloroplast DNA during development in Arabidopsis

Beth A Rowan et al. BMC Plant Biol. .

Abstract

Background: A decline in chloroplast DNA (cpDNA) during leaf maturity has been reported previously for eight plant species, including Arabidopsis thaliana. Recent studies, however, concluded that the amount of cpDNA during leaf development in Arabidopsis remained constant.

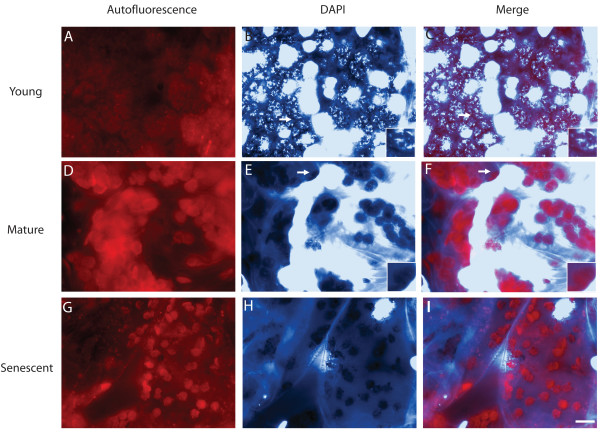
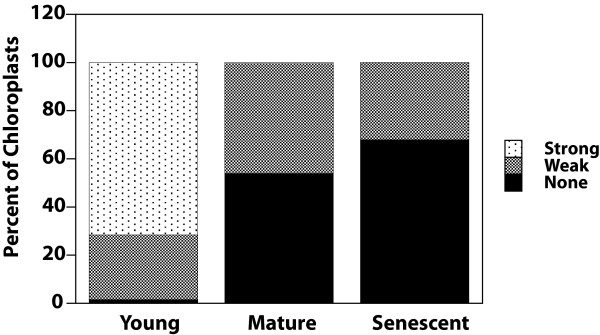
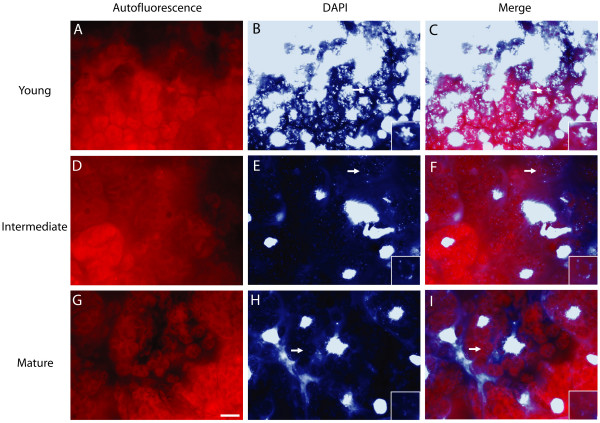
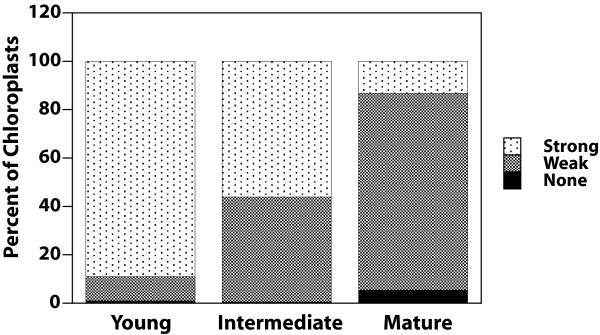
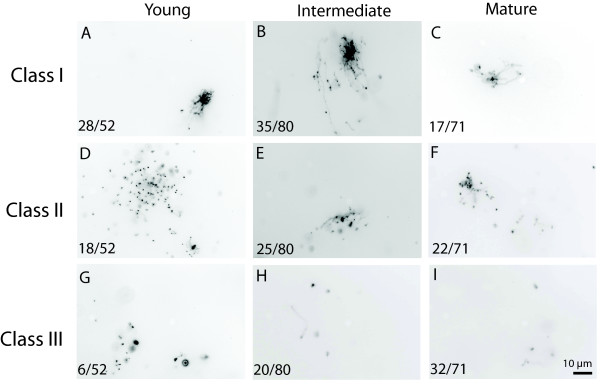
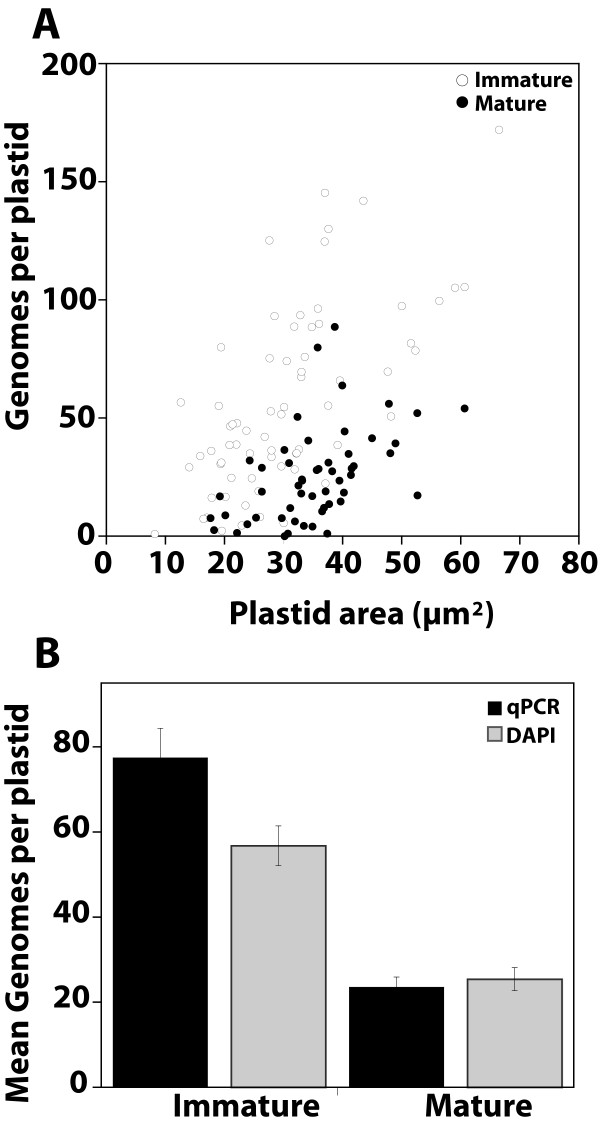
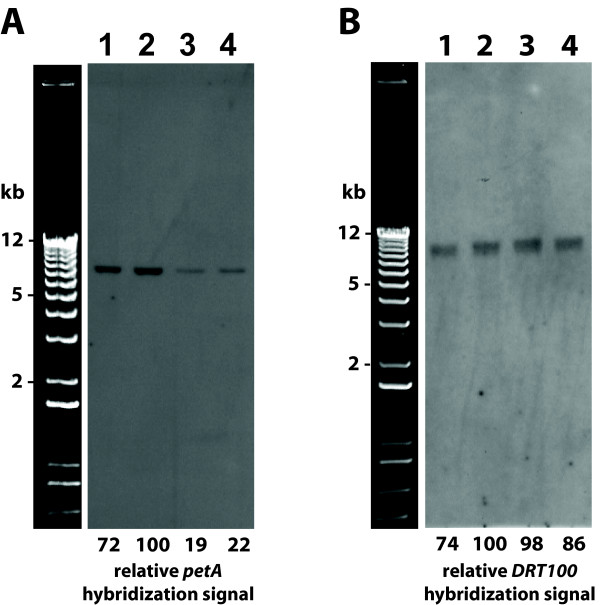
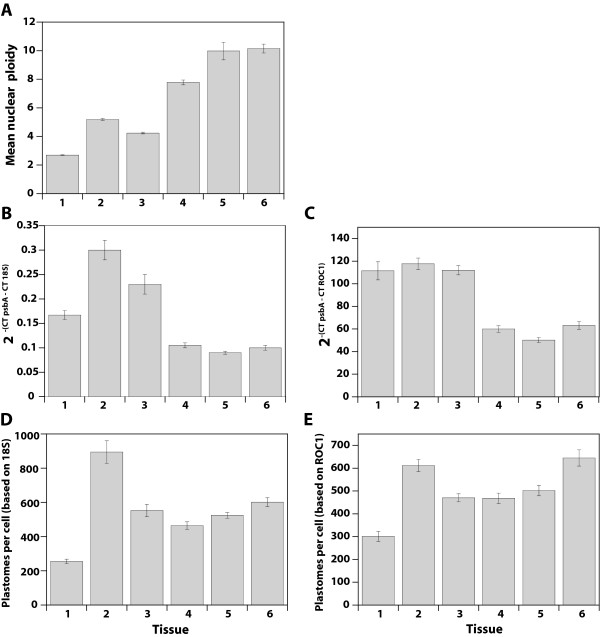
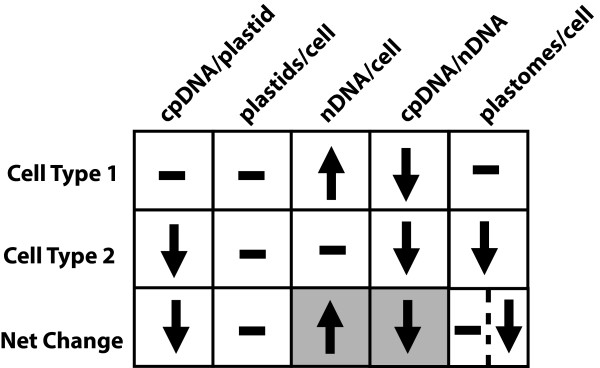
Results: To evaluate alternative hypotheses for these two contradictory observations, we examined cpDNA in Arabidopsis shoot tissues at different times during development using several methods: staining leaf sections as well as individual isolated chloroplasts with 4',6-diamidino-2-phenylindole (DAPI), real-time quantitative PCR with DNA prepared from total tissue as well as from isolated chloroplasts, fluorescence microscopy of ethidium-stained DNA molecules prepared in gel from isolated plastids, and blot-hybridization of restriction-digested total tissue DNA. We observed a developmental decline of about two- to three-fold in mean DNA per chloroplast and two- to five-fold in the fraction of cellular DNA represented by chloroplast DNA.

Conclusion: Since the two- to five-fold reduction in cpDNA content could not be attributed to an artifact of chloroplast isolation, we conclude that DNA within Arabidopsis chloroplasts is degraded in vivo as leaves mature.


Figures

Figure 1
Figure 1
DAPI-DNA staining of cytological sections for rosette leaves. (A-C) First rosette leaf from a 9-day-old plant. (D-F) First rosette leaf from a 31-day-old plant. (G-I) Senescent rosette leaf from a 45-day-old plant. Leaves were sectioned by hand and immediately fixed with glutaraldehyde. Chlorophyll autofluorescence (A, D, G), DAPI-DNA staining (B, E, H), and merged images (C, F, I) are shown. These images are representative of 9–10 microscopic fields from mid-leaf sections of the leaves. Images of autofluorescence and DAPI-DNA staining were recorded at the same exposure times for all samples. The large circular and elliptical intensely DAPI-stained objects correspond to nuclei. The DNA content in mitochondria is much less than in plastids for Arabidopsis [7], so it is likely that none of the DAPI staining in these images corresponds to mitochondria. White bar in (I), 10 μm, applies to all panels. White arrows indicate chloroplasts that have been magnified 2.9-fold and displayed in the insets shown in the bottom right corners of B, C and E, F.
Figure 2
Figure 2
DAPI-DNA intensity of chloroplasts of leaf sections shown in Figure 1. Plastids with dense, bright nucleoids were classified as "strong", and those with dispersed, faint nucleoids or no visible nucleoids were scored as "weak" or "none", respectively. At least 100 chloroplasts were evaluated from among 9–10 microscopic fields for each of the sections represented in Figure 1.
Figure 3
Figure 3
DAPI-DNA staining of cytological sections for cauline leaves. (A-C) Second cauline leaf from a 19-day-old plant. (D-F) Second cauline leaf from a 23-day-old plant. (G-I) Second cauline leaf from a 26-day-old plant. Leaves were sectioned by hand and immediately fixed with glutaraldehyde. Chlorophyll autofluorescence (A, D, G), DAPI-DNA staining (B, E, H), and merged images (C, F, I) are shown. These images are representative of 9–10 microscopic fields from mid-leaf sections of the leaves. Images of autofluorescence and DAPI-DNA staining were recorded at the same exposure times for all samples. White bar in (G), 10 μm, applies to all panels. White arrows indicate chloroplasts that have been magnified 2.9-fold and displayed in the insets shown in the bottom right corners of B and C, E and F, and H and I.
Figure 4
Figure 4
DAPI-DNA intensity of chloroplasts of leaf sections shown in Figure 3. Plastids with dense, bright nucleoids were classified as "strong", and those with dispersed, faint nucleoids or no visible nucleoids were scored as "weak" or "none", respectively. At least 100 chloroplasts were evaluated from among 9–10 microscopic fields for each of the sections represented in Figure 3.
Figure 5
Figure 5
Comparison of the structural forms of cpDNA molecules from different tissues. EtBr-stained cpDNA from young (A, D, G; 9-day-old first and second rosette leaves), intermediate (B, E, H; entire 20-day-old shoots), and mature (C, F, I; third rosette leaf of a 31-day-old plant) was visualized by fluorescence microscopy and characterized by structural class. (A-C) Class I structures: complex forms consisting of a network of connected fibers or fibers connected to a large, dense core. (D-F) Class II structures: complex forms with a greater number of disconnected fibers than connected fibers. (G-I) Class III structures: disconnected fibers without a complex form. Values at the bottom left corner represent the number of molecules in a particular structural class out of the total number of structures observed for each tissue. The scale bar shown in (I) applies to all images.
Figure 6
Figure 6
Comparison of genome copy number per plastid by DAPI-DNA staining and real-time quantitative PCR (qPCR) for different tissues. (A) Genome copy number per plastid from DAPI-DNA fluorescence and plastid size for individual plastids. Plastids from immature tissue (entire shoots from 13-day-old seedlings) and mature tissue (first and second leaves of 20-day-old plants) are compared. The sample sizes are 68 and 53, respectively. (B) DNA obtained from the same samples described in (A) was quantified by real-time qPCR, and the mean genome copy number per plastid is compared to that value determined by DAPI-DNA fluorescence. For both methods, the mean copy number per plastid for the immature tissue was significantly greater than the mature tissue (P < 0.0001). Chloroplasts from young first and second rosette leaves of 12-day-old plants also exhibit a large range in genomes per plastid (0.8 to 203) that becomes reduced in mature first and second rosette leaves of 26-day-old plants (0 to 82) as determined by DAPI-staining (not shown). The mean genome copy number is also significantly lower for these mature leaves (24 ± 3) than for these immature leaves (58 ± 7). The sample sizes are 46 and 62, respectively.
Figure 7
Figure 7
Changes in cpDNA content during development as determined by blot-hybridization. Total tissue DNA after digestion with SpeI, gel electrophoresis and blot-hybridization using a cpDNA probe (A; petA) and a nuclear DNA probe (B; DRT100). Lanes 1: First and second leaves from 12-day-old plants. Lanes 2: Entire 16-day-old shoots. Lanes 3: Third and fourth leaves from 36-day-old plants. Lanes 4: First and second leaves from 37-day-old plants. Blot-hybridization using the cpDNA probe was also performed on the DNA samples shown in lanes 2 and 3 after digestion with HindIII and NotI (data not shown). The DNA sample in lanes 2 had a five-fold greater (HindIII) or a two-fold greater (NotI) quantified signal than that in lanes 3. We also performed a dot-blot using a dilution series of the DNA samples in lanes 2 and 3. For both samples, a two-fold reduction in DNA resulted in an approximately two-fold reduction in signal intensity of the petA probe (see Materials and Methods).
Figure 8
Figure 8
Changes in the ratio of nuclear to chloroplast DNA and chloroplast genomes (plastomes) per cell using qPCR. (A) Mean ploidy level (C-value) determined by flow cytometry (B) Ratio of the amount of copies of the chloroplast psbA gene relative to that of the multiple copy nuclear 18S rRNA gene calculated using the 2-ΔCT method of qPCR analysis. (C) Ratio of the amount of copies of the chloroplast psbA gene relative to that of the single copy nuclear ROC1 gene calculated using the 2-ΔCT method of qPCR analysis. (D) Plastome copy number per cell assessed by multiplying the ratio of psbA copies to 18S rRNA copies (described in (B)) by the mean number of 18S rRNA genes per haploid nuclear genome (see text) and by the mean ploidy level of the tissues (see Table 1). (E) Plastome copy number per cell assessed by multiplying the ratio of psbA copies to ROC1 copies (described in (C)) by the mean ploidy level of the tissues (see Table 1). Tissue samples 1–6 are described in the legend of Table 1.
Figure 9
Figure 9
A model for change in cpDNA and nuclear DNA (nDNA) amount during development. The change in parameters affecting cpDNA and nDNA amount between immature and mature tissues is represented. Two cell types are shown, along with the net change expected for a population of both cell types. Arrows indicate an increase or decrease. Dashes indicate no change. In Type 1 cells, cpDNA/plastid and plastids/cell are constant, and the nDNA increase leads to a decrease in cpDNA/nDNA. In Type 2 cells, cpDNA/plastid declines, but both plastid number and nDNA remain constant, leading to a decrease in cpDNA/nDNA. The net change for the population is an increase in nDNA, no change in plastids/cell, and a decrease in both cpDNA/plastid and cpDNA/nDNA. Shaded boxes indicate the parameters used to calculate plastomes/cell, based on qPCR and mean ploidy using flow cytometry. Data obtained from these methods represent the net change in nDNA and cpDNA/nDNA for the population and do not assess the cpDNA/plastid. The net increase in nDNA/cell is similar to the net decrease in cpDNA/nDNA because Type 1 cells contribute to the increase in ploidy without contributing greatly to the change in cpDNA/nDNA. As a result, calculation of plastomes/cell yields a similar value for immature and mature tissues, and there appears to be no net change in plastomes/cell (left half of the box in the bottom right corner). If qPCR and flow cytometry could be performed on each cell type separately, calculation of plastomes/cell would reveal no change for Type 1, a decrease for Type 2, and a net decrease for the population (right half of the box), because the contribution of individual cells to the increase in nuclear ploidy and decrease in cpDNA/nDNA could be assessed.

References

    1. Martin W, Herrmann RG. Gene transfer from organelles to the nucleus: how much, what happens, and why? Plant Physiol. 1998;118:9–17. - PMC - PubMed
    1. Timmis JN, Ayliffe MA, Huang CY, Martin W. Endosymbiotic gene transfer: organelle genomes forge eukaryotic chromosomes. Nat Rev Genet. 2004;5:123–135. - PubMed
    1. Coleman AW. Use of the fluorochrome 4'6-diamidino-2-phenylindole in genetic and developmental studies of chloroplast DNA. J Cell Biol. 1979;82:299–305. - PMC - PubMed
    1. Kuroiwa T. The replication, differentiation, and inheritance of plastids with emphasis on the concept of organelle nuclei. Int Rev Cytol. 1991;128:1–61.
    1. Lamppa GK, Bendich AJ. Changes in chloroplast DNA levels during development of pea (Pisum sativum) Plant Physiol. 1979;64:126–130. - PMC - PubMed

Publication types

MeSH terms

LinkOut - more resources