. 2009 Jan 9;4(1):80-93.
doi: 10.1016/j.stem.2008.11.011.

Chromatin signatures in multipotent human hematopoietic stem cells indicate the fate of bivalent genes during differentiation

Affiliations

Chromatin signatures in multipotent human hematopoietic stem cells indicate the fate of bivalent genes during differentiation

Kairong Cui et al. Cell Stem Cell. .

Abstract

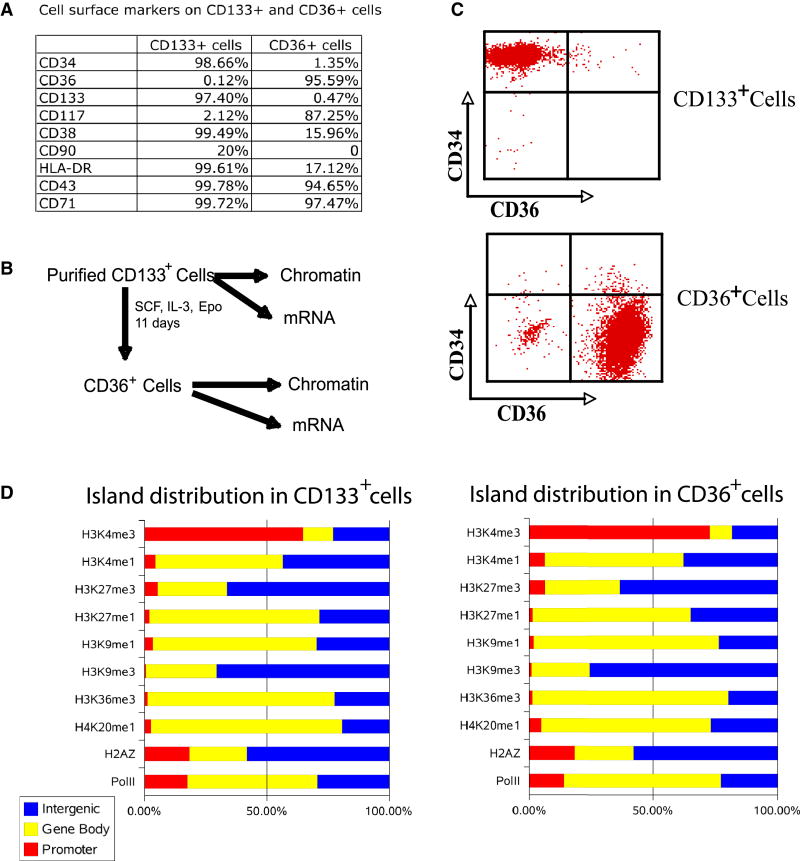
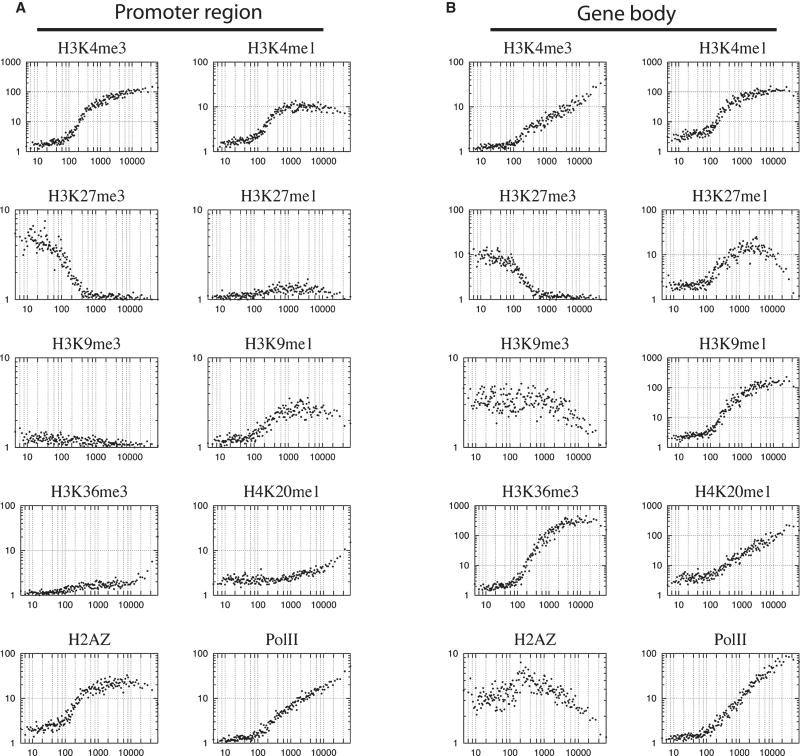
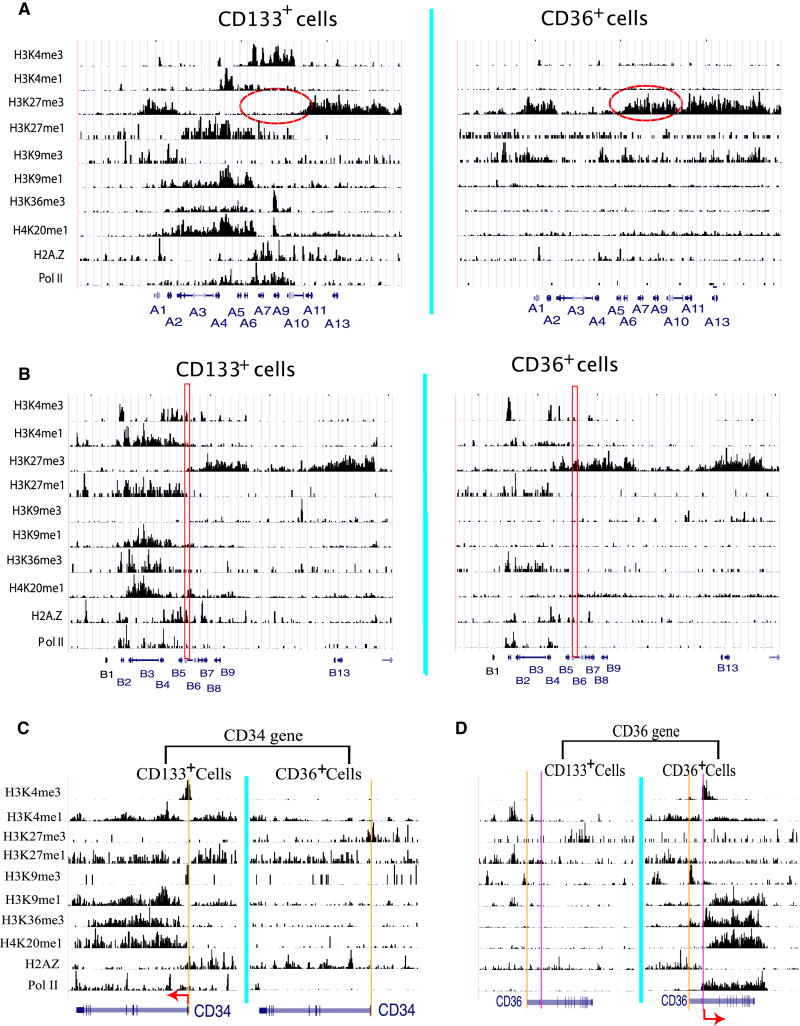
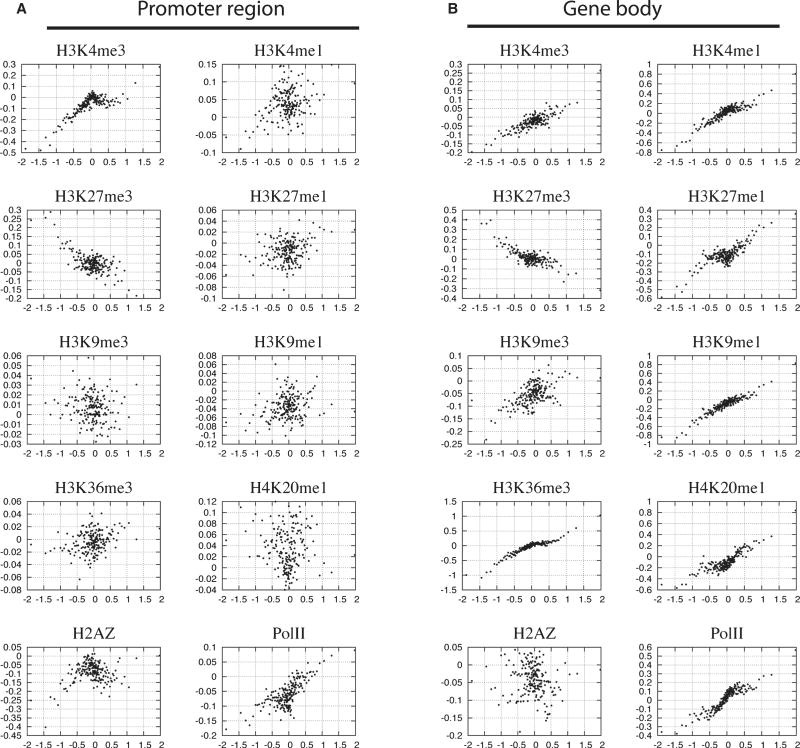
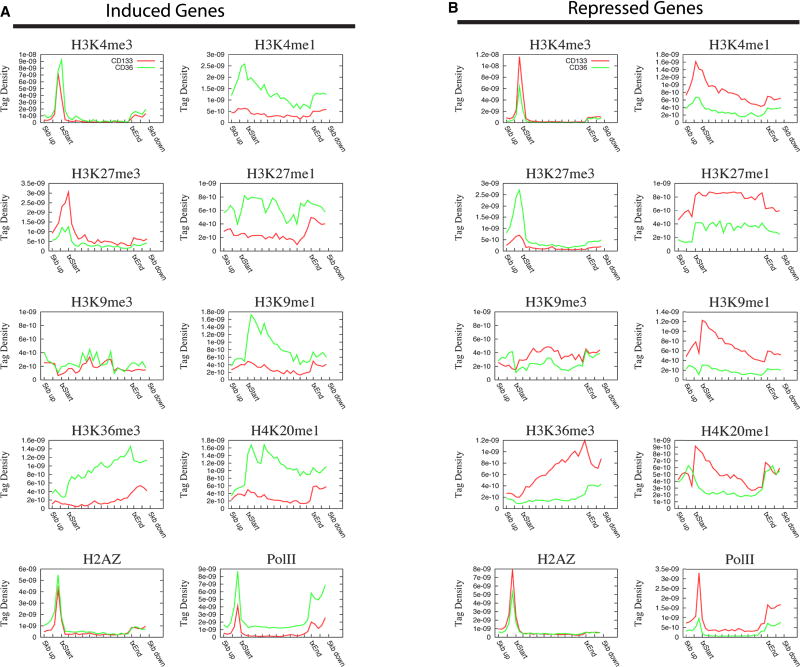
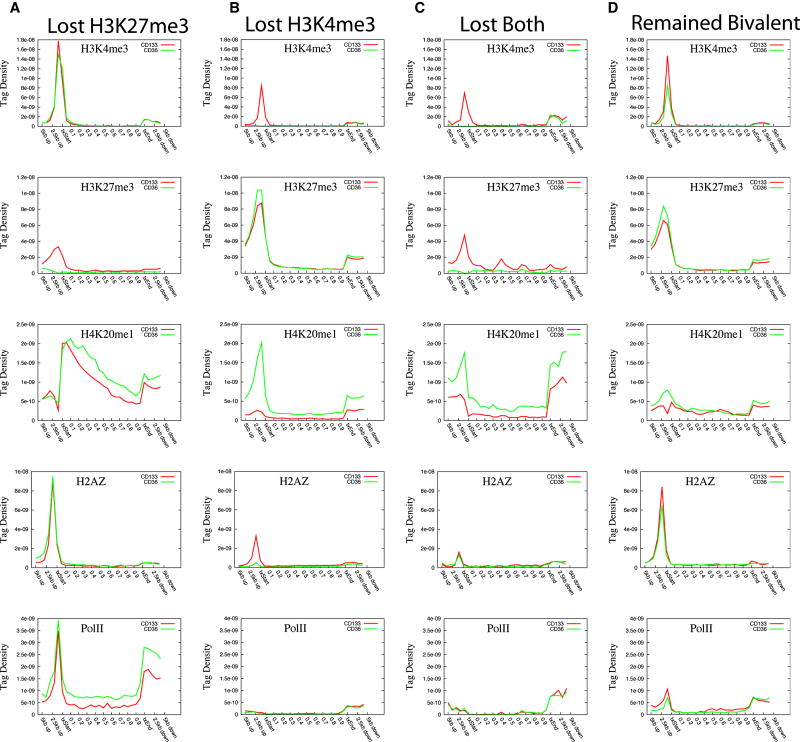
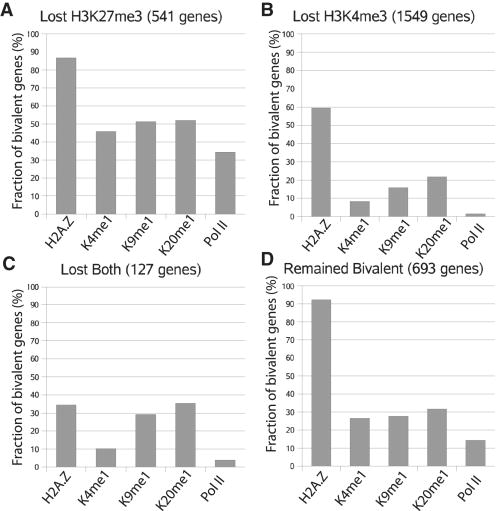
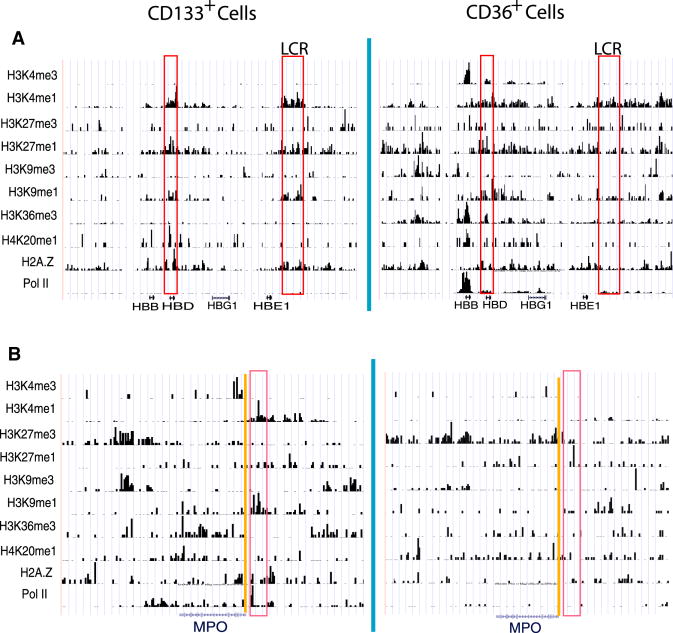
Histone modifications have been implicated in stem cell maintenance and differentiation. We have analyzed genome-wide changes in gene expression and histone modifications during differentiation of multipotent human primary hematopoietic stem cells/progenitor cells (HSCs/HPCs) into erythrocyte precursors. Our data indicate that H3K4me1, H3K9me1, and H3K27me1 associate with enhancers of differentiation genes prior to their activation and correlate with basal expression, suggesting that these monomethylations are involved in the maintenance of activation potential required for differentiation. In addition, although the majority of genes associated with both H3K4me3 and H3K27me3 in HSCs/HPCs become silent and lose H3K4me3 after differentiation, those that lose H3K27me3 and become activated after differentiation are associated with increased levels of H2A.Z, H3K4me1, H3K9me1, H4K20me1, and RNA polymerase II in HSCs/HPCs. Thus, our data suggest that gene expression changes during differentiation are programmed by chromatin modifications present at the HSC/HPC stage and provide a resource for enhancer and promoter identification.


Figures

Figure 1
Figure 1. Differentiation of CD133+ cells into CD36+ cells
A. Cell surface markers on CD133+ and CD36+ cells. The cells were stained using specific antibodies indicated on the left column and analyzed by flow cytometry. The fractions of cells exhibited positive staining for each antibody are indicated. B. Experimental scheme. C. FACS analysis of the CD34 and CD36 expression levels before (upper panel) and after (lower panel) differentiation. D. The genome-wide distribution of different modifications. Total numbers of islands in promoter, gene body and intergenic regions were identified for each modification (see Experimental Procedures for details). The graph shows the fraction of islands in each different region for each modification in CD133+ and CD36+ cells.
Figure 2
Figure 2. Correlation between histone modification and gene expression in CD36+ cells
Genes were grouped to 100-gene (one dot in the figure) sets according to expression level. The histone modification levels in promoter (A) and gene body (B) regions were calculated for the same 100-gene sets (see Experimental Procedure for detail). The y-axis indicates the histone modification level and x-axis indicates the expression level.
Figure 3
Figure 3. Changes in histone modifications accompany changes in gene expression during differentiation
A. Histone modification profiles in the HoxA locus (chr7:27,054,903-27,243,612) in CD133+ and CD36+ cells. The data are displayed as custom tracks on the UCSC genome browser. The positions of the HoxA genes are indicated below the panel. Y-axis shows the number of sequence reads detected in 200 bp-windows and x-axis shows the chromosome coordinates in the genome. B. Histone modification profiles in the HoxB locus (chr17:43,931,826-44,203,425) in CD133+ and CD36+ cells. The positions of the HoxB genes are indicated below the panel. The promoter region of the HoxB6 gene is highlighted in red. C. Histone modification profiles in the CD34 gene locus (chr1:206,110,000-206,170,000) in CD133+ and CD36+ cells. The position and direction of transcription of the CD34 gene are indicated below the panel. The coordinate of the annotated TSS is indicated by the vertical orange line. D. Histone modification profiles in the CD36 gene locus (chr7:80,090,000-80,170,000) in CD133+ and CD36+ cells. The position and direction of transcription of the CD34 gene are indicated below the panel. The vertical orange line indicates the annotated TSS and the vertical pink line indicates the actual TSS.
Figure 4
Figure 4. Correlation between changes in histone modification and gene expression during differentiation from CD133+ to CD36+ cells
The fold changes in both expression level and histone modification level were calculated for each gene during differentiation. The genes were grouped into 100-gene sets according to their expression changes and the changes were averaged for each set of 100 genes (one dot in the figure); the histone modification changes were then averaged for the same sets of 100-genes. The y-axis indicates the fold change (log10 scale) of histone modification in the promoter region (A) or gene body region (B). The x-axis indicates that the fold change in expression levels. The clear gaps in some figures are due to cut-off thresholds of histone modification islands.
Figure 5
Figure 5. Histone modification profiles in induced (A) and repressed (B) genes during differentiation of CD133+ cells (red) to CD36+ cells (green)
The tag density for modifications (see Supplementary Information for detail) is shown across the gene bodies as well as 5 kb 5′ and 3′ of the gene bodies.
Figure 6
Figure 6. Distinct histone modification changes are associated with different fates of the bivalent genes
Histone modification profiles for the bivalent genes that lost H3K27me3 (A), H3K4me3 (B), both H3K27me3 and H3K4me3 (C), or remained as bivalent (D), during differentiation. H3K4me3, H3K27me3, H4K20me1, H2A.Z and Pol II profiles are shown here. The profiles for other modifications are shown in Figure S13.
Figure 7
Figure 7. The fate of bivalent genes after differentiation is linked to the chromatin modification patterns in HSCs/HPCs
The fraction of the bivalent genes associated with H2A.Z, H3K4me1, H3K9me1, H4K20me1 and Pol II was indicated for those that lost H3K27me3 (A), lost H3K4me3 (B), lost both (C), or remained bivalent (D) after differentiation.
Figure 8
Figure 8. H3K4me1, H3K9me1 and H3K27me1 modifications mark critical regulatory regions before gene activation
The histone modification profiles at the β-globin locus (chr11:5,171,954-5,279,020) (A) and MPO (chr17:53,682,809-53,732,673) (B) genomic regions in CD133+ and CD36+ cells are displayed. The critical promoter or enhancer regions are highlighted in red.

Comment in

References

    1. Ansel KM, Djuretic I, Tanasa B, Rao A. Regulation of Th2 differentiation and Il4 locus accessibility. Annu Rev Immunol. 2006;24:607–656. - PubMed
    1. Azuara V, Perry P, Sauer S, Spivakov M, Jorgensen HF, John RM, Gouti M, Casanova M, Warnes G, Merkenschlager M, Fisher AG. Chromatin signatures of pluripotent cell lines. Nat Cell Biol. 2006;8:532–538. - PubMed
    1. Barski A, Cuddapah S, Cui K, Roh TY, Schones DE, Wang Z, Wei G, Chepelev I, Zhao K. High-resolution profiling of histone methylations in the human genome. Cell. 2007;129:823–837. - PubMed
    1. Bernstein BE, Kamal M, Lindblad-Toh K, Bekiranov S, Bailey DK, Huebert DJ, McMahon S, Karlsson EK, Kulbokas EJ, 3rd, Gingeras TR, et al. Genomic maps and comparative analysis of histone modifications in human and mouse. Cell. 2005;120:169–181. - PubMed
    1. Bernstein BE, Mikkelsen TS, Xie X, Kamal M, Huebert DJ, Cuff J, Fry B, Meissner A, Wernig M, Plath K, et al. A bivalent chromatin structure marks key developmental genes in embryonic stem cells. Cell. 2006;125:315–326. - PubMed

Publication types

MeSH terms