

How much do genetic covariances alter the rate of adaptation?
- PMID: 19129097
- PMCID: PMC2679087
- DOI: 10.1098/rspb.2008.1671
How much do genetic covariances alter the rate of adaptation?
Abstract
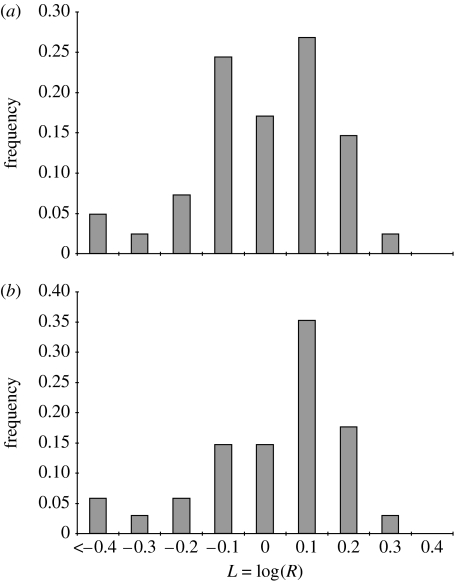
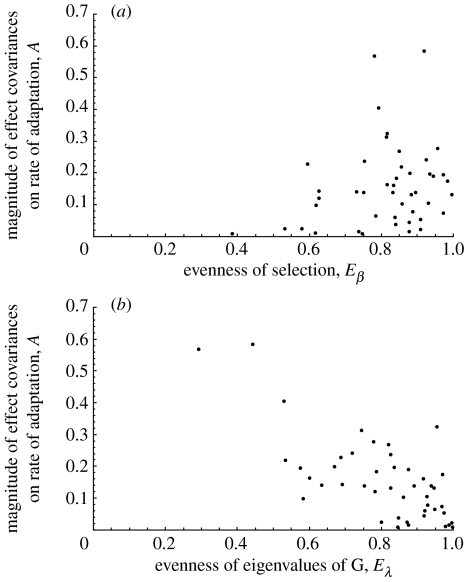
Genetically correlated traits do not evolve independently, and the covariances between traits affect the rate at which a population adapts to a specified selection regime. To measure the impact of genetic covariances on the rate of adaptation, we compare the rate fitness increases given the observed G matrix to the expected rate if all the covariances in the G matrix are set to zero. Using data from the literature, we estimate the effect of genetic covariances in real populations. We find no net tendency for covariances to constrain the rate of adaptation, though the quality and heterogeneity of the data limit the certainty of this result. There are some examples in which covariances strongly constrain the rate of adaptation but these are balanced by counter examples in which covariances facilitate the rate of adaptation; in many cases, covariances have little or no effect. We also discuss how our metric can be used to identify traits or suites of traits whose genetic covariances to other traits have a particularly large impact on the rate of adaptation.
Figures
References
-
- Arnold S.J. Constraints on phenotypic evolution. Am. Nat. 1992;140:S85–S107. doi:10.1086/285398 - DOI - PubMed
-
- Beldade P., Koops K., Brakefield P.M. Developmental constraints versus flexibility in morphological evolution. Nature. 2002;416:844–847. doi:10.1038/416844a - DOI - PubMed
-
- Bell A.E., Burris M.J. Simultaneous selection for two correlated traits in Tribolium. Genet. Res. 1973;21:29–46.
-
- Blows M.W. A tale of two matrices: multivariate approaches in evolutionary biology. J. Evol. Biol. 2007;20:1–8. doi:10.1111/j.1420-9101.2006.01164.x - DOI - PubMed
-
- Blows M.W., Hoffmann A.A. A reassessment of genetic limits to evolutionary change. Ecology. 2005;86:1371–1384. doi:10.1890/04-1209 - DOI
Publication types
MeSH terms
LinkOut - more resources
Full Text Sources
Other Literature Sources