

Individual experience and evolutionary history of predation affect expression of heritable variation in fish personality and morphology
- PMID: 19129142
- PMCID: PMC2660958
- DOI: 10.1098/rspb.2008.1555
Individual experience and evolutionary history of predation affect expression of heritable variation in fish personality and morphology
Abstract
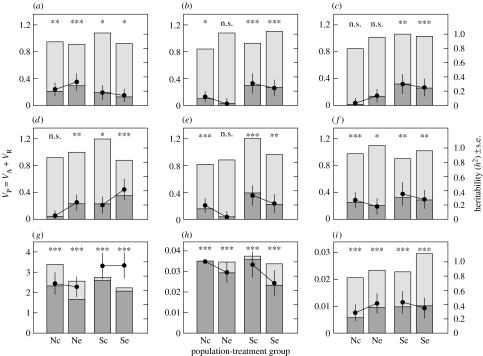
Predation plays a central role in evolutionary processes, but little is known about how predators affect the expression of heritable variation, restricting our ability to predict evolutionary effects of predation. We reared families of three-spined stickleback Gasterosteus aculeatus from two populations-one with a history of fish predation (predator sympatric) and one without (predator naive)-and experimentally manipulated experience of predators during ontogeny. For a suite of ecologically relevant behavioural ('personality') and morphological traits, we then estimated two key variance components, additive genetic variance (VA) and residual variance (VR), that jointly shape narrow-sense heritability (h2=VA/(VA+VR)). Both population and treatment differentially affected VA versus VR, hence h2, but only for certain traits. The predator-naive population generally had lower VA and h2 values than the predator-sympatric population for personality behaviours, but not morphological traits. Values of VR and h2 were increased for some, but decreased for other personality traits in the predator-exposed treatment. For some personality traits, VA and h2 values were affected by treatment in the predator-naive population, but not in the predator-sympatric population, implying that the latter harboured less genetic variation for behavioural plasticity. Replication and experimental manipulation of predation regime are now needed to confirm that these population differences were related to variation in predator-induced selection. Cross-environment genetic correlations (rA) were tight for most traits, suggesting that predator-induced selection can affect the evolution of the same trait expressed in the absence of predators. The treatment effects on variance components imply that predators can affect evolution, not only by acting directly as selective agents, but also by influencing the expression of heritable variation.
Figures
References
-
- Akaike H. Information theory and an extension of the maximum likelihood principle. In: Petran B.N., Csáki F., editors. International symposium on information theory. Akadémiai Kiadi; Budapest, Hungary: 1973. pp. 267–281.
-
- Arnold S.J., Phillips P.C. Hierarchical comparison of genetic variance–covariance matrices. II. Coastal–inland divergence in the garter snake, Thamnophis elegans. Evolution. 1999;53:1516–1527. doi:10.2307/2640897 - DOI - PubMed
-
- Astles P.A., Moore A.J., Preziosi R.F. A comparison of methods to estimate cross-environment genetic correlations. J. Evol. Biol. 2006;19:114–122. doi:10.1111/j.1420-9101.2005.00997.x - DOI - PubMed
-
- Barber I., Arnott S.A. Split-clutch IVF: a technique to examine indirect fitness consequences of mate preferences in sticklebacks. Behaviour. 2000;137:1129–1140. doi:10.1163/156853900502484 - DOI
-
- Bell A.M. Behavioral differences between individuals and two populations of stickleback (Gasterosteus aculeatus) J. Evol. Biol. 2005;18:464–473. doi:10.1111/j.1420-9101.2004.00817.x - DOI - PubMed
Publication types
MeSH terms
LinkOut - more resources
Full Text Sources
