. 2009 Mar;37(4):1095-106.
doi: 10.1093/nar/gkn1057. Epub 2009 Jan 7.

Transcriptional control by adenovirus E1A conserved region 3 via p300/CBP

Affiliations

Transcriptional control by adenovirus E1A conserved region 3 via p300/CBP

Peter Pelka et al. Nucleic Acids Res. 2009 Mar.

Abstract

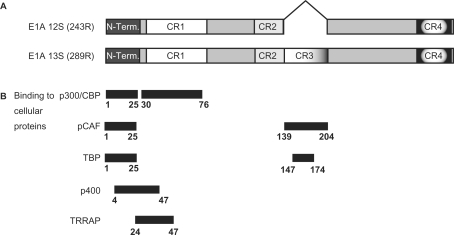
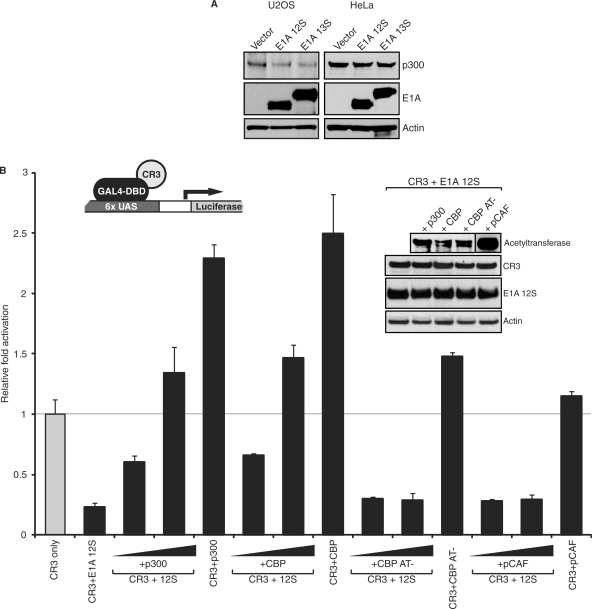
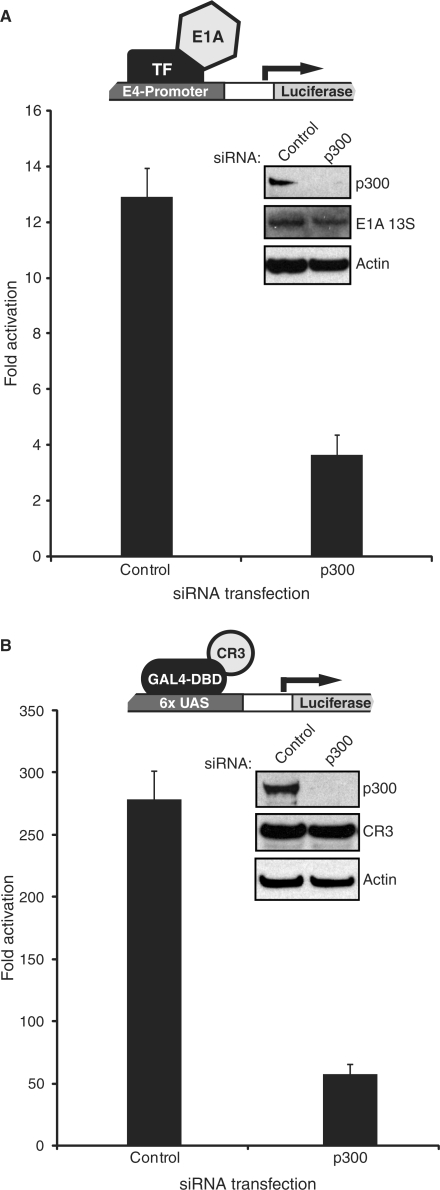
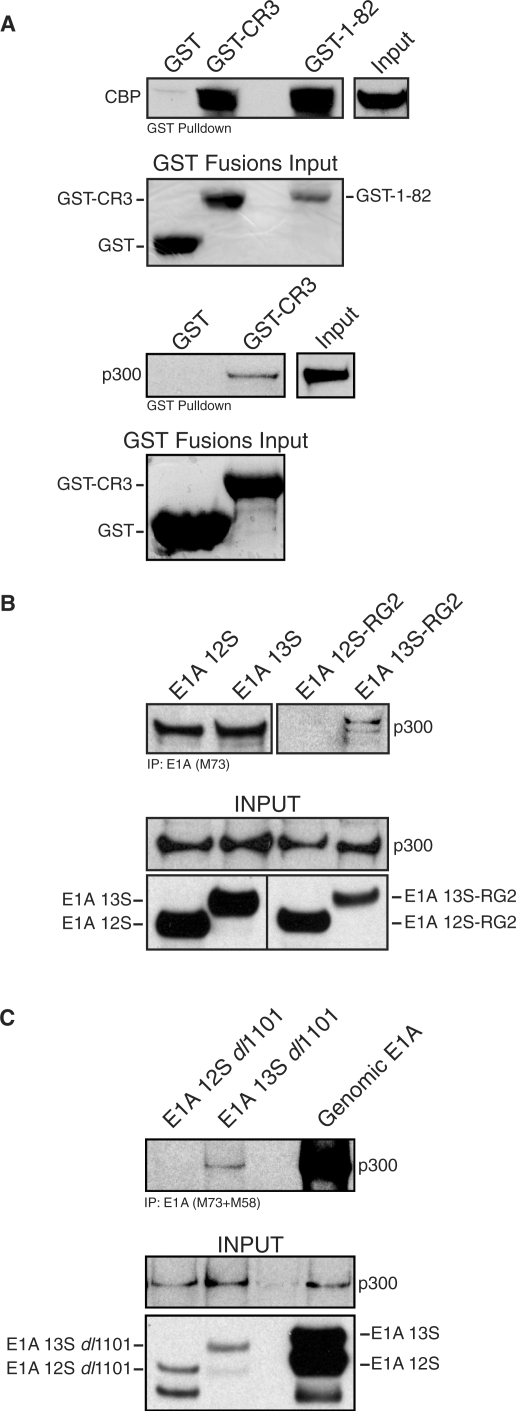
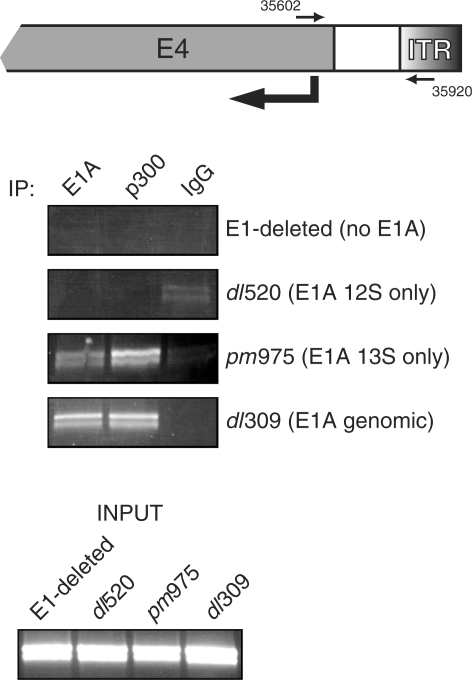
The human adenovirus type 5 (HAdV-5) E1A 13S oncoprotein is a potent regulator of gene expression and is used extensively as a model for transcriptional activation. It possesses two independent transcriptional activation domains located in the N-terminus/conserved region (CR) 1 and CR3. The protein acetyltransferase p300 was previously identified by its association with the N-terminus/CR1 portion of E1A and this association is required for oncogenic transformation by E1A. We report here that transcriptional activation by 13S E1A is inhibited by co-expression of sub-stoichiometric amounts of the smaller 12S E1A isoform, which lacks CR3. Transcriptional inhibition by E1A 12S maps to the N-terminus and correlates with the ability to bind p300/CBP, suggesting that E1A 12S is sequestering this limiting factor from 13S E1A. This is supported by the observation that the repressive effect of E1A 12S is reversed by expression of exogenous p300 or CBP, but not by a CBP mutant lacking actyltransferase activity. Furthermore, we show that transcriptional activation by 13S E1A is greatly reduced by siRNA knockdown of p300 and that CR3 binds p300 independently of the well-characterized N-terminal/CR1-binding site. Importantly, CR3 is also required to recruit p300 to the adenovirus E4 promoter during infection. These results identify a new functionally significant interaction between E1A CR3 and the p300/CBP acetyltransferases, expanding our understanding of the mechanism by which this potent transcriptional activator functions.


Figures

Figure 1.
Figure 1.
Schematic of E1A isoforms and locations of binding sites for indicated proteins. (A) Schematic representation of E1A 12S and E1A 13S splice isoforms. (B) Binding sites for p300/CBP, pCAF, TBP, p400 and TRRAP on E1A are indicated.
Figure 2.
Figure 2.
Repression of E1A 13S- and CR3-mediated transactivation by E1A 12S is dose-dependent and independent of the method by which E1A is targeted to the promoter. (A) HeLa cells were co-transfected with plasmids expressing E1A 13S (1.5 μg) and E1A 12S (as indicated) together with an adenovirus E3-luciferase reporter plasmid (0.5 μg). Luciferase activity was assayed 48 hours after transfection. TF, transcription factor. (B) HeLa cells were co-transfected with plasmids expressing E1A 13S (1.5 μg) and E1A 12S (as indicated) together with an adenovirus E4-luciferase reporter plasmid (0.5 μg). Luciferase activity was assayed 48 h after transfection. (C) U2OS cells were co-transfected with plasmids expressing a GAL4 DNA-binding domain-CR3 (1 μg) fusion and E1A 12S (as indicated) together with a GAL4 responsive luciferase reporter (1 μg). Luciferase activity was assayed 24 h after transfection.
Figure 3.
Figure 3.
Repression of CR3 transactivation by E1A 12S maps to the N-terminal/CR1 region. (A) Schematic representation of E1A 12S and the locations of fragments used as GFP fusions in the squelching assay. (B) U2OS cells were co-transfected with 0.1 μg of the indicated GFP-E1A fragment fusions, GAL4-CR3 (1 μg) and a GAL4-luciferase reporter (1 μg). Luciferase activity was assayed 24 h after transfection and the results were plotted versus GAL4-CR3 (shown in grey), which was set to 1.
Figure 4.
Figure 4.
Repression of CR3 transactivation by E1A 12S maps to the same regions that bind p300/CBP. (A) Schematic representation of E1A 12S deletion mutants within exon 1 used in the study. (B) U2OS cells were co-transfected with 0.1 μg of the indicated E1A 12S deletion mutants together with GAL4-CR3 (1 μg) and a GAL4-luciferase reporter (1 μg). Luciferase activity was assayed 24 h after transfection and the results were plotted versus GAL4-CR3 (shown in grey), which was set to 1. (C) U2OS cells were co-transfected with GAL4-CR3 fusion (1 μg), GAL4-luciferase reporter (1 μg) and 0.1 μg of E1A 12SRG2 or wild-type E1A 12S. Luciferase activity was assayed 24 h after transfection and the results were plotted versus GAL4-CR3 (shown in grey), which was set to 1.
Figure 5.
Figure 5.
Overexpression of p300 or CBP restores E1A 12S-repressed CR3 transactivation. (A) U2OS or HeLa cell extracts from cells transfected with empty vector, E1A 12S expression plasmid or E1A 13S expression plasmid were assayed for levels of endogenous p300 and E1A. (B) U2OS cells were co-transfected with plasmids expressing GAL4-CR3 (600 ng) and 600 ng of vectors expressing the indicated acetyltransferases, together with a GAL4-luciferase reporter plasmid (600 ng) and 60 ng of E1A 12S as indicated. Luciferase activity was assayed 24 h after transfection and the data was plotted versus CR3 alone (shown in grey), which was set to 1. Overexpressed p300, CBP, CBP AT- and pCAF were detected using anti-HA antibody for p300 and anti-FLAG M2 for CBP, CBP AT- and pCAF.
Figure 6.
Figure 6.
Knockdown of p300 by siRNA impairs activation by E1A 13S and CR3. (A) HeLa cells were transfected with siRNA for p300 or a negative control siRNA and subsequently with 1 μg of plasmid expressing E1A 13S and 1 μg of E4-luciferase reporter. Luciferase activity was assayed 5 days after the initial siRNA transfection. (B) U2OS cells were transfected with siRNA for p300 or a negative control siRNA and subsequently with 1 μg of plasmid expressing the GAL4-CR3 fusion and 1 μg of GAL4-luciferase reporter. Luciferase activity was assayed 5 days after the initial siRNA transfection.
Figure 7.
Figure 7.
p300/CBP bind directly to E1A CR3. (A) Top panel: Full-length, purified FLAG-tagged CBP was incubated with either purified GST, GST-CR3 or GST-E1A-1-82. Protein complexes were then bound to Glutathione Sepharose 4B beads, washed and resolved on 4–12% gradient SDS–PAGE. Associated CBP was detected with anti-FLAG M5 monoclonal antibody, and input levels of GST-fusion proteins were determined by Ponceau S staining of the same membrane. Bottom panel: A549 total cell extract was incubated with either purified GST or GST-CR3. Protein complexes were then bound to Glutathione Sepharose 4B beads, washed and resolved on 4–12% gradient SDS–PAGE. The blot was probed for p300 using RW128 anti-p300 antibody and input levels of GST-fusion proteins was determined using Ponceau S staining of the same membrane. (B) HeLa cells were transfected with plasmids expressing either wild-type E1A 12S, 13S, 12SRG2 or 13SRG2 together with a plasmid expressing HA-tagged p300. Immunoprecipitations were carried out using M73 anti-E1A antibody and the proteins were resolved on a 4–12% gradient SDS–PAGE and western blots performed for p300 using the RW128 anti-p300 antibody. Input levels are shown. (C) HeLa cells were transfected with plasmids expressing either wild-type genomic E1A, E1A 12Sdl1101 or E1A 13Sdl1101, and immunoprecipitated with a mix of M73 and M58 anti-E1A antibodies. The immunoprecipitated proteins were resolved on a 3–8% gradient SDS–PAGE and Western blots performed for p300 using the RW128 anti-p300 antibody. Input levels are shown.
Figure 8.
Figure 8.
p300 is recruited to the adenovirus E4 promoter only in the presence of E1A 13S. Top panel. A schematic representation of the right end of the adenoviral genome with the locations of primer hybridization indicated, numbering refers to the adenovirus type 2 genome. Bottom panel. HeLa cells were infected with the indicated adenoviruses and chromatin immunoprecipitation was carried out 16 h after infection with M73 anti-E1A antibody, RW128 anti-p300 antibody and mouse anti-rabbit antibody as a negative control. Immunoprecipitated DNA was then subjected to PCR analysis using E4-specific primers and the product was resolved on a 2% agarose gel.

References

    1. Berk AJ. Recent lessons in gene expression, cell cycle control, and cell biology from adenovirus. Oncogene. 2005;24:7673–7685. - PubMed
    1. Bayley ST, Mymryk JS. Adenovirus E1A proteins and transformation (Review) Int. J. Oncology. 1994;5:425–444. - PubMed
    1. Kimelman D, Miller JS, Porter D, Roberts BE. E1a regions of the human adenoviruses and of the highly oncogenic simian adenovirus 7 are closely related. J. Virol. 1985;53:399–409. - PMC - PubMed
    1. Avvakumov N, Wheeler R, D'Halluin JC, Mymryk JS. Comparative sequence analysis of the largest E1A proteins of human and simian adenoviruses. J. Virol. 2002;76:7968–7975. - PMC - PubMed
    1. Avvakumov N, Kajon AE, Hoeben RC, Mymryk JS. Comprehensive sequence analysis of the E1A proteins of human and simian adenoviruses. Virology. 2004;329:477–492. - PubMed

Publication types

MeSH terms

Substances