. 2009 Mar;37(4):1049-60.
doi: 10.1093/nar/gkn1028. Epub 2009 Jan 7.

Identification of an inter-transcription factor regulatory network in human hepatoma cells by Matrix RNAi

Affiliations

Identification of an inter-transcription factor regulatory network in human hepatoma cells by Matrix RNAi

Yasuhiro Tomaru et al. Nucleic Acids Res. 2009 Mar.

Abstract

Transcriptional regulation by transcriptional regulatory factors (TRFs) of their target TRF genes is central to the control of gene expression. To study a static multi-tiered inter-TRF regulatory network in the human hepatoma cells, we have applied a Matrix RNAi approach in which siRNA knockdown and quantitative RT-PCR are used in combination on the same set of TRFs to determine their interdependencies. This approach focusing on several liver-enriched TRF families, each of which consists of structurally homologous members, revealed many significant regulatory relationships. These include the cross-talks between hepatocyte nuclear factors (HNFs) and the other TRF groups such as CCAAT/enhancer-binding proteins (CEBPs), retinoic acid receptors (RARs), retinoid receptors (RXRs) and RAR-related orphan receptors (RORs), which play key regulatory functions in human hepatocytes and liver. In addition, various multi-component regulatory motifs, which make up the complex inter-TRF regulatory network, were identified. A large part of the regulatory edges identified by the Matrix RNAi approach could be confirmed by chromatin immunoprecipitation. The resultant significant edges enabled us to depict the inter-TRF TRN forming an apparent regulatory hierarchy of (FOXA1, RXRA) --> TCF1 --> (HNF4A, ONECUT1) --> (RORC, CEBPA) as the main streamline.


Figures

Figure 1.
Figure 1.
RNAi knockdown of 19 TRF genes in HepG2 cells. Knockdown ratio was calculated according to the ΔΔCT method (23) and the averages of the ΔΔCT values in four biological replicates are indicated with SD (error bar).
Figure 2.
Figure 2.
Distribution of perturbation magnitudes between significant and non-significant edges. The 85 edges showed a low SD (mean > 2 SD) and a low P-value (P < 0.05) in Student's t-test were selected as significant edge candidates. The remaining 295 edges, except 19 autoregulatory edges, were grouped together as non-significant edges. The edges in each group were divided according to their perturbation magnitudes, which were represented by absolute ΔΔCT, in every 0.2 absolute ΔΔCT and the percentages of the number of edges in each fraction to the total number of the edges were plotted. Perturbation magnitude was calculated on the basis of the data of qRT-PCR assay (see qRT-PCR in Materials and Methods section for details). White bars represent the percentage of the number of significant edges and black bars are for non-significant edges.
Figure 3.
Figure 3.
Magnitude of perturbation for high and low SD and P-value groups. The edges exhibiting a mean ΔΔCT smaller or larger than 2 SD and a P-value higher or lower than 0.05 were divided into two separate groups consisting of 85 significant and 295 non-significant edges. Mean and SD values of ΔΔCTs of high (<2 SD and P > 0.05) and low (>2 SD and P < 0.05) SD and P-value groups were calculated. ΔΔCT values for knockdown (KD) of the TRF genes are much larger than perturbation magnitudes, indicating that the influences of KD of TRF genes on their downstream TRF genes tend to attenuate.
Figure 4.
Figure 4.
Perturbation of the TRF gene expression by two different siRNA species. Each of the three TRF genes was individually knocked down in HepG2 cells by either of the two different siRNAs specific to each of them, and changes in expression levels of 21 TRF genes were measured by qRT-PCR. The average ΔΔCT, SD and P values were obtained from triplicated experiments. Correlation coefficients were calculated on the basis of average ΔΔCT values.
Figure 5.
Figure 5.
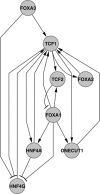
Perturbation network among HNFs. For depiction of the putative network, only significant edges (>2 SD and P < 0.05) among HNFs (TCF1, TCF2, FOXA1, FOXA2, FOXA3, HNF4A, HNF4G and ONECUT1) were extracted on the basis of Matrix RNAi data (Table 1). The network graph was drawn by Cytoscape (50). In this graph, TRFs and TRF genes regulated by them are not distinguished from each other, but the nodes emitting and accepting an arrow represent the putative regulators and regulated genes, respectively.
Figure 6.
Figure 6.
X-ChIP/qPCR analysis of six selected TRFs. TRF–TRF gene binding analysis was performed for six TRFs (TCF1, FOXA1, FOXA2, HNF4A, ONECUT1 and RXRA) by using the chromatin samples prepared from the siRNA-untreated HepG2 cells. Enrichment of the specific DNA fragments that are bound by a TRF is indicated by ΔCT (difference in the CT values observed for the ChIP samples with specific antibody and those observed without any antibody; see TRF binding assay by X-ChIP/qPCR in Materials and methods section for details). Error bars represent the SD between three separate experiments. Only the TRF genes exhibited the enrichment threshold (ΔCT >1.0, mean > 2 SD and P < 0.05) are shown. Black bars indicate autoregulatory edges.
Figure 7.
Figure 7.
Correlation between TRF binding- and perturbation-positive edges. A total of 40 regulatory edges that showed a perturbation with a low 2 SD value and a low P-value (<0.05) targeted by any of the six TRFs whose chromatin bindings were examined and were selected to determine the correlation with TRF–TRF gene interaction. Binding-positive 73 TRF edges that showed more than 1.0 of the enrichment index ΔCT with a low 2 SD value and P < 0.05 in Student's t-test were also selected. Autoregulatory edges are not included in this figure because Matrix RNAi cannot identify them through perturbation. Numbers in parentheses indicate the edges that have been reported in literature (Supplementary Table 8).
Figure 8.
Figure 8.
A highly probable static inter-TRF TRN in HepG2 cells. The edges presented were identified by Matrix RNAi perturbation. Highly significant edges confirmed by X-ChIP/qPCR are drawn in thick lines. Rhombus boxes represent TRFs that were tested in X-ChIP/qPCR. TRFs lacking a significant binding data are excluded from this figure. Autoregulation of all of these six TRFs was demonstrated but not drawn for clarity. Lines with arrowheads and T-shaped termini show positive and negative regulatory edges, respectively.
Figure 9.
Figure 9.
Strategy flow of matrix RNAi-based TRN analysis. (Left) The experimental flow chart, (right) top, example of matrix RNAi results; middle, example of TRF binding results; bottom, example of the validated TRN (TRF1 and TRF4 are autoregulated; black arrows indicate a positive regulatory edge, and the dashed line with a black circle from TRF2 to TRF1 indicates negative regulation.

References

    1. Simon I, Barnett J, Hannett N, Harbison CT, Rinaldi NJ, Volkert TL, Wyrick JJ, Zeitlinger J, Gifford DK, Jaakkola TS, et al. Serial regulation of transcriptional regulators in the yeast cell cycle. Cell. 2001;106:697–708. - PubMed
    1. Lee TI, Rinaldi NJ, Robert F, Odom DT, Bar-Joseph Z, Gerber GK, Hannett NM, Harbison CT, Thompson CM, Simon I, et al. Transcriptional regulatory networks in Saccharomyces cerevisiae. Science. 2002;298:799–804. - PubMed
    1. Sandmann T, Girardot C, Brehme M, Tongprasit W, Stolc V, Furlong EE. A core transcriptional network for early mesoderm development in Drosophila melanogaster. Genes Dev. 2007;21:436–449. - PMC - PubMed
    1. Suzuki M, Hayashizaki Y. Mouse-centric comparative transcriptomics of protein coding and non-coding RNAs. Bioessays. 2004;26:833–843. - PubMed
    1. Dannenberg JH, David G, Zhong S, van der Torre J, Wong WH, Depinho RA. mSin3A corepressor regulates diverse transcriptional networks governing normal and neoplastic growth and survival. Genes Dev. 2005;19:1581–1595. - PMC - PubMed

Publication types

MeSH terms

Substances