. 2009 Mar;37(4):1061-72.
doi: 10.1093/nar/gkn1036. Epub 2009 Jan 7.

The Torso signaling pathway modulates a dual transcriptional switch to regulate tailless expression

Affiliations

The Torso signaling pathway modulates a dual transcriptional switch to regulate tailless expression

Yu-Chien Chen et al. Nucleic Acids Res. 2009 Mar.

Abstract

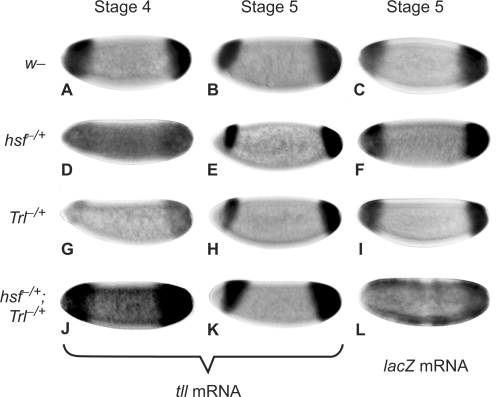
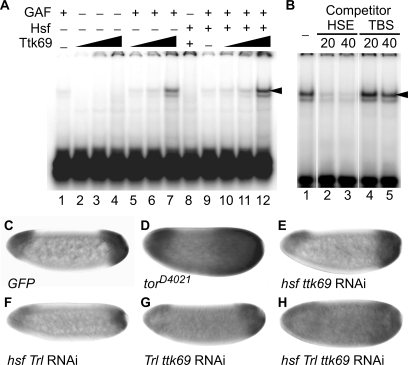
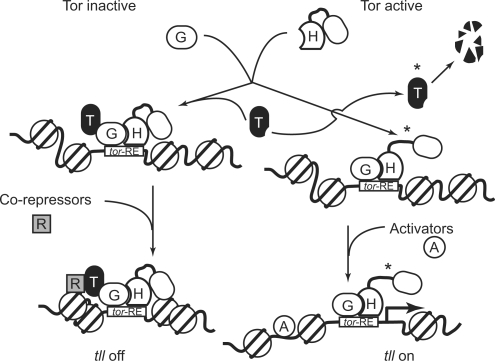
The Torso (Tor) signaling pathway activates tailless (tll) expression by relieving tll repression. None of the repressors identified so far, such as Capicuo, Groucho and Tramtrack69 (Ttk69), bind to the tor response element (tor-RE) or fully elucidate tll repression. In this study, an expanded tll expression pattern was shown in embryos with reduced heat shock factor (hsf) and Trithorax-like (Trl) activities. The GAGA factor, GAF encoded by Trl, bound weakly to the tor-RE, and this binding was enhanced by both Hsf and Ttk69. A similar extent of expansion of tll expression was observed in embryos with simultaneous knockdown of hsf, Trl and ttk69 activities, and in embryos with constitutively active Tor. Hsf is a substrate of mitogen-activated protein kinase and S378 is the major phosphorylation site. Phosphorylation converts Hsf from a repressor to an activator that works with GAF to activate tll expression. In conclusion, the GAF/Hsf/Ttk69 complex binding to the tor-RE remodels local chromatin structure to repress tll expression and the Tor signaling pathway activate tll expression by modulating a dual transcriptional switch.


Figures

Figure 1.
Figure 1.
hsf activity is likely to participate in tll repression. (A–D) tll mRNA patterns in embryos at early stage 4 (A and C) and stage 5 (B and D) were determined by in situ hybridization with a digoxigenin-labeled antisense tll RNA. w1118 embryos were incubated at either 25 (A and B) or 29°C (C and D). Embryos are arranged in a sagittal view, with the anterior towards the left. (E–H) lacZ protein distribution in embryos from G11 (E and G) or hsf4; G11 (F and H) parents was determined by X-gal staining. The heat-shock treatment (hs) was at 37°C for 30 min (G and H). G11 embryos serve as controls (E and G). Embryos at early stage 5 are shown, with the anterior towards the left.
Figure 2.
Figure 2.
The genetic interaction of hsf with Trl is critical for tll repression and activation. Embryos from females of w1118 (A–C), hsf1/+ (D–F), TrlDHΔ34/+ (G–I) and hsf1/+; TrlDHΔ34/+ (J–L) crossed with G11 males were used to determine the tll expression patterns (A, B, D, E, G, H, J and K) and lacZ (C, F, I and L) using in situ hybridization with digoxigenin-labeled antisense tll and lacZ RNA, respectively. Expression patterns at either late stage 4 or early stage 5 are indicated by stage 4 and 5. Genotypes of females are shown to the left. Embryos are arranged in a sagittal view, with the anterior towards the left.
Figure 3.
Figure 3.
Hsf alters the DNA-binding property of GAF. (A) EMSA was performed using a 25-bp 32P-labeled probe with various amounts of proteins. The volume of the control was 2 μl (lanes 1–7). Various volumes of Hsf (1.25, 2.5 and 5 μl in lanes 5–7; 5 μl in lanes 8–10) and GAF (1, 2 and 4 μl in lanes 2–4 and 8–10) were used. The DNA–protein complexes were separated in a 4% polyacrylamide gel and detected using a PhosphoImager (GE/Amersham Biosciences). An arrow head and arrow indicate the tor-RE bound by a monomer and dimer, respectively. (B) Shift-western blotting of the complexes formed with GAF (4 μl in lanes 1, 3, 4, 6 and 7), Hsf (5 μl in lanes 2, 3, 5, 6 and 7) and the labeled probe. Quantity of the probe was 5-fold higher than that used in EMSA. GAF and Hsf on the nitrocellulose membrane were detected by immunoblotting with anti-GAF and Hsf antibodies, respectively. The ‘auto’ represents an autoradiogram that shows position of the radiolabeled probe on the nylon membrane. The DNA–protein complexes indicated by an arrow and arrow head are the same as those shown in (A). (C) DNaseI footprinting was used to show where Hsf, GAF or GAF/Hsf binds in the tll-MRR. The control is proteins extracted from bacteria carrying the pET28a vector. The protein concentrations of the control, GAF and Hsf proteins determined by the Bio-Rad protein assay (Bio-Rad Laboratories, Inc.) are 2.24, 1.75 and 0.34 mg/ml, respectively. Various amounts of proteins were incubated with the probe in a final volume of 50 μl. The reaction mixture was incubated at room temperature for 10 min. A constant volume of control (2 μl in lanes 2 and 4–6) and Hsf (10 μl in lanes 3 and 7–9) were used, whereas various volumes of GAF (1, 2 and 4 μl; represented by triangles) were used (lanes 4–6 and 7–9). Brightness of lane 5 is reduced by 15%. Regions protected by GAF alone are highlighted by open rectangles (a–d) at the right of lane 6. Comparing intensities of bands in lanes 9 with those in lane 6, bands with decreased and increased intensity are marked by asterisks and close circles at the right of lane 9, respectively. Numbers at the left indicate distance in nucleotide from the BstNI site (Supplementary Figure S2).
Figure 4.
Figure 4.
GAF, Hsf and Ttk69 form a stable complex on the tor-RE, repressing tll expression. (A) The bacterially expressed Ttk69 (0.15 mg/ml) was used to test whether Ttk69 enhanced GAF/Hsf binding to the tor-RE using EMSA. The probe, GAF and Hsf were the same as those used in Figure 3A. GAF (2 μl in lanes 1, 5–7 and 9–12) and Hsf (3 μl in lanes 8–12) were mixed with various volumes of Ttk69 (1, 2 and 4 μl in lanes 2–4, 5–7 and 10–12; and 2 μl in lane 8). (B) A competition experiment shows association of Ttk69 with GAF/Hsf on the tor-RE. HSE, formula image 
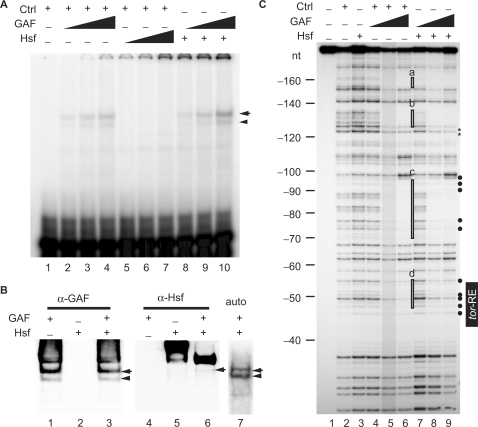
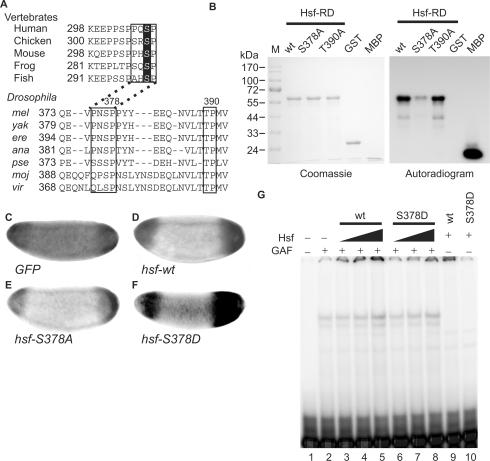
(binding sites for Hsf and GAF are underlined and shadowed, respectively), and a Ttk69 binding site in the even-skipped cis-regulatory region, TCCTCATGGTCCTGCCGAGCAG (TBS), were used as competitor DNAs. The folds in molar excess of the competitor DNAs, HSE and TBS, are shown on top of lanes 2–5. Using a PhosphoImager, the radioactivities of the upper bands indicated by an arrow head in (A and B) were measured for quantitative analysis of DNA binding. (C–H) tll expression patterns in embryos with various combinations of RNAi to knockdown hsf, Trl or ttk69 activities, as shown at bottom of each panel. tll expression patterns in embryos with GFP (C) or TorD4021 (D) expression serve as controls. Embryos are arranged in a sagittal view, with the anterior towards the left.
Figure 5.
Figure 5.
Rpd3 activity participates in tll repression. Embryos from females of w1118 (A), ttkle11/+ (B), Rpd3303/+ (C) and ttkle11/Rpd3303 (D) crossed with w1118 males were used to determine tll expression patterns using in situ hybridization. The genotypes of the females are indicated at the bottom of each panel. tll expression patterns in embryos at late stage 4 are shown. Embryos are arranged in a sagittal view, with the anterior towards the left.
Figure 6.
Figure 6.
Phosphorylation by Mapk converts Hsf from a repressor to an activator for tll expression. (A) Amino acid sequences of HSF1s in vertebrates were retrieved from Genbank and the regulatory domains of these HSF1s (HSF-RD) were aligned using the ClustalW program to reveal conserved amino acids. Putative Mapk recognition sequences are boxed and S307, a target site of Mapk in HSF1s, is highlighted. The same procedure was applied to Hsfs in Drosophila species including melanogaster (mel), yakuba (yak), erecta (ere), ananassae (ana), pseudoobscura (pse), mojavensis (moj) and virilis (vir). Amino acid sequences in boxes that contain two putative Mapk phosphorylation sites, S378 and T390, are highly conserved among Drosophila species. (B) In an in vitro phosphorylation assay, 100 pmol of GST-Hsf-RD and two mutant forms (GST-RD-S378A and T390A), as well as negative (GST) and positive (myelin basic protein, MBP) controls were used. After incubation with Mapk and γ[32P]-ATP, the proteins were separated in a 12% SDS gel and visualized using Coomassie blue staining, shown at the left. After the gel was dried, autoradiography was used to reveal the phosphorylated proteins, shown at the right. (C–F) tll expression patterns in late stage-4 embryos from mothers transheterozygous for hsf1 and TrlDHΔ34, determined by in situ hybridization, are shown and the anterior is arranged towards the left. Supplementation with UAS-hsf-wt (D), -S378A (E) and -S378D (F) driven by GAL4-GCN4 suppresses the expanded tll expression patterns. GFP expression was used as a negative control (C). (G) Hsf-S378D binding to the tor-RE is enhanced by GAF. The protein concentration of Hsf-S378D is 0.34 mg/ml. The Hsf, GAF and the probe were the same as those used in Figure 3A. GAF (4 μl) was mixed with various volumes of Hsf (wt) or Hsf-S378D (S378D) (2.5 μl in lanes 3 and 6; 5 μl in lanes 4 and 7; and 10 μl in lanes 5 and 8–10) and 32P-labeled probe. The DNA–protein complexes were separated in a 4% polyacrylamide gel and visualized using a PhosphoImager.
Figure 7.
Figure 7.
A model illustrates how GAF, Hsf and Ttk69 form a repression complex on the tor-RE to initiate tll repression and how the Tor pathway regulates transcriptional switches. Letters A, H, G, R and T inside the cartoons represent activators, Hsf, GAF, co-repressors and Ttk69. Proteins phosphorylated by Mapk are indicated by asterisks.

Similar articles

Cited by

References

    1. Li WX. Functions and mechanisms of receptor tyrosine kinase Torso signaling: lessons from Drosophila embryonic terminal development. Dev. Dyn. 2005;232:656–672. - PMC - PubMed
    1. Schlessinger J. Cell signaling by receptor tyrosine kinases. Cell. 2000;103:211–225. - PubMed
    1. Hill CS, Treisman R. Transcriptional regulation by extracellular signals: mechanisms and specificity. Cell. 1995;80:199–211. - PubMed
    1. Barolo S, Posakony JW. Three habits of highly effective signaling pathways: principles of transcriptional control by developmental cell signaling. Genes Dev. 2002;16:1167–1181. - PubMed
    1. Sprenger F, Stevens LM, Nusslein-Volhard C. The Drosophila gene torso encodes a putative receptor tyrosine kinase. Nature. 1989;338:478–483. - PubMed

Publication types

MeSH terms