. 2009 Feb;37(3):e21.
doi: 10.1093/nar/gkn1027. Epub 2009 Jan 7.

Telomere length measurement by a novel monochrome multiplex quantitative PCR method

Affiliations

Telomere length measurement by a novel monochrome multiplex quantitative PCR method

Richard M Cawthon. Nucleic Acids Res. 2009 Feb.

Abstract

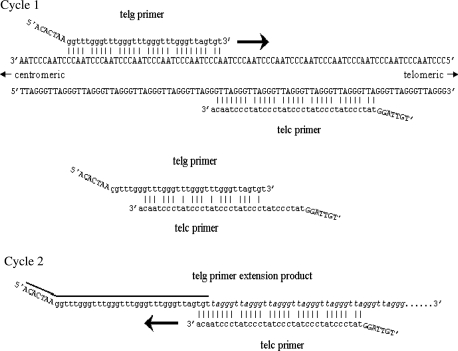
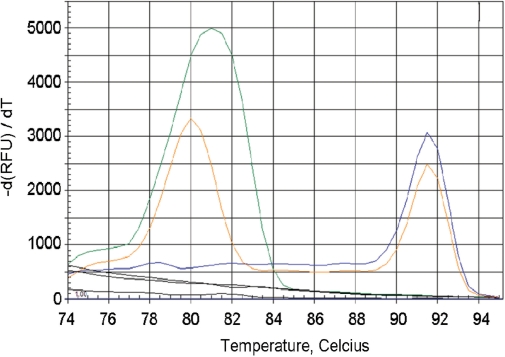
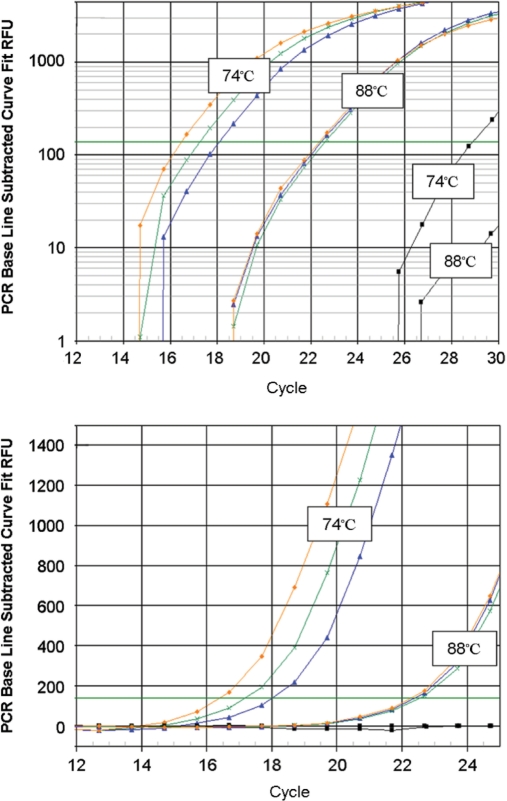
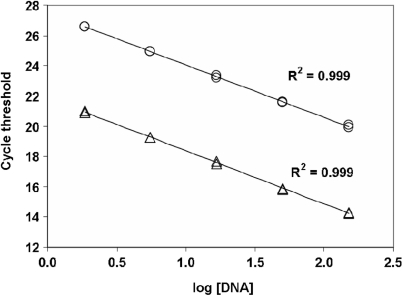
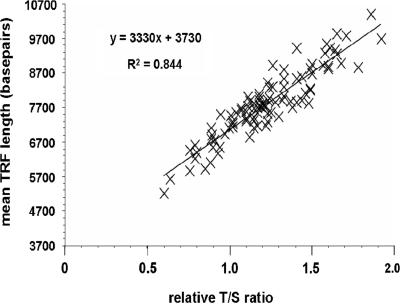
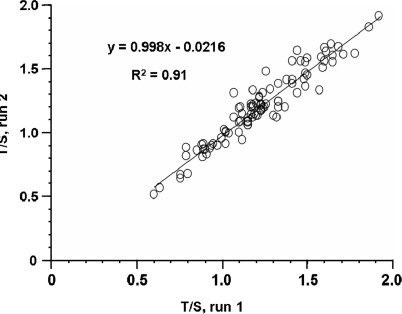
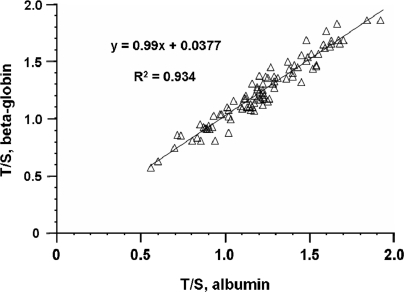
The current quantitative polymerase chain reaction (QPCR) assay of telomere length measures telomere (T) signals in experimental DNA samples in one set of reaction wells, and single copy gene (S) signals in separate wells, in comparison to a reference DNA, to yield relative T/S ratios that are proportional to average telomere length. Multiplexing this assay is desirable, because variation in the amount of DNA pipetted would no longer contribute to variation in T/S, since T and S would be collected within each reaction, from the same input DNA. Multiplexing also increases throughput and lowers costs, since half as many reactions are needed. Here, we present the first multiplexed QPCR method for telomere length measurement. Remarkably, a single fluorescent DNA-intercalating dye is sufficient in this system, because T signals can be collected in early cycles, before S signals rise above baseline, and S signals can be collected at a temperature that fully melts the telomere product, sending its signal to baseline. The correlation of T/S ratios with Terminal Restriction Fragment (TRF) lengths measured by Southern blot was stronger with this monochrome multiplex QPCR method (R(2) = 0.844) than with our original singleplex method (R(2) = 0.677). Multiplex T/S results from independent runs on different days were highly reproducible (R(2) = 0.91).


Figures

Figure 1.
Figure 1.
In Cycle 1 the telg primer hybridizes to native telomere sequences and primes DNA synthesis. The telc primer hybridizes native telomere sequences but cannot prime DNA synthesis, due to its 3′ terminal mismatch. When hybridized to each other as shown, and in other configurations not shown, telg and telc have multiple mismatches, including at their 3′ terminal bases, so primer dimer formation is inhibited. The 3′ ends of telg and telc can also align as a perfectly complementary 3 bp overlap, but this is not stable enough to allow efficient primer dimer formation. In Cycle 2, telc can hybridize along telg primer extension products that were synthesized in Cycle 1, but can only prime DNA synthesis when hybridized in the configuration shown, since other configurations produce a mismatch at telc's 3′ terminal base. In the telg extension product, the overbar marks the sequence of the telg primer itself, and the italicized bases mark sequence newly synthesized in Cycle 1 of the PCR. The non-templated capitalized sequences at the 5′ ends of the primers prevent the 3′ ends of the telomere PCR product from priming DNA synthesis in the middle of other copies of the telomere PCR product.
Figure 2.
Figure 2.
Melting curves following 25 cycles of amplification (thermal profile given in Materials and methods section) of 150 ng of human genomic DNA with telomere primers only (green curve), albumin primers only (blue curve) or both primer sets (orange curve). No template control melting curves are in black. After the final 88°C incubation, reactions were cooled to 72°C, and signal was acquired from 72°C to 95°C, in 0.5°C steps, with a 30 s dwell period per step. There is approximately an 11°C difference in the melting temperatures of the telomere and albumin amplicons. Clearly, 88°C is a good choice for acquiring SYBR Green I signal from the albumin amplicon without interference from the telomere amplicon, which is completely melted at that temperature.
Figure 3.
Figure 3.
MMQPCR of 20 ng of each of three reference human DNA samples previously shown to have long telomeres (orange curves), middle-length telomeres (green curves) or short telomeres (blue curves). No template control amplification curves are in black. Top panel: semi-log plot and bottom panel: linear plot. Here, special care was taken to input essentially identical amounts of DNA into the reactions (based on OD260 UV spectrophotometer readings), so that the differences in Ct observed at 74°C would reflect only differences in telomere length (without influence from variation in the amounts of input DNA). (In normal practice, there is no need to precisely match experimental samples for input DNA, since the procedure of normalizing the T signal to the S signal addresses this issue. A wide range of input DNA amounts are acceptable, as long as both T and S signals fall within the range of the T and S standard curves; see Figure 4.) The nearly perfect overlap of the three amplification curves acquired at 88°C is expected, since only the single copy gene (albumin gene) signal is collected at this temperature. The bottom panel shows that the cycle thresholds for the telomere signals can be collected at 74°C when the albumin signal is still at baseline. (We have confirmed, in reactions without the telomere primers, that the single copy gene signal rises above baseline at essentially the same cycle number whether collected at 74°C or 88°C. Also, we have confirmed, in reactions without the single copy gene primers, that the telomere amplification signal is completely flat and at zero throughout the PCR run when read at 88°C, as would be expected based on the melting profiles shown in Figure 2.) Since the Bio-Rad MyiQ software can display only one temperature's amplification curves at a time, here we have superimposed the displays for the 74°C and 88°C reads.
Figure 4.
Figure 4.
Standard curves used to determine relative T/S ratios. Five concentrations of a standard human genomic DNA sample spanning an 81-fold range were prepared by 3-fold serial dilutions (150 ng, 50 ng, 16.7 ng, 5.55 ng and 1.85 ng per well), and aliquoted in duplicate to a 96-well PCR plate. Both target and reference fluorescent signals were collected from each reaction well. Circles, data for the single copy gene albumin, acquired at 88°C and triangles, data for telomere repeats, acquired at 74°C. The same standard DNA was used to set up standard curve reactions in every plate in the study.
Figure 5.
Figure 5.
Correlation of relative T/S ratios measured by MMQPCR with albumin as the single copy gene, and mean TRF lengths determined by Southern blot analysis, in whole blood DNA samples from 95 individuals. Each T/S value is the average of triplicate measurements; each mean TRF length is the average of duplicate measurements. The linear regression equation and correlation coefficient were determined using Microsoft Excel.
Figure 6.
Figure 6.
Reproducibility of relative T/S ratios in independent runs of the MMQPCR assay. The same 95 DNA samples assayed in Figure 5 were assayed again the next day, taking care that the specific MyiQ PCR machine and reaction well positions occupied by each DNA sample were different from the previous day. The linear regression equation and correlation coefficient were determined using Microsoft Excel.
Figure 7.
Figure 7.
Correlation between T/S ratios obtained with albumin as the single copy gene versus beta-globin as the single copy gene. Relative T/S ratios were measured in the same 95 DNA samples, in triplicate, in two separate runs, substituting the beta-globin primers for the albumin primers. For each sample, the average T/S from the two separate runs with albumin as the single copy gene (x-axis) is plotted against the average T/S from the two runs with beta-globin as the single copy gene (y-axis). The linear regression equation and correlation coefficient were determined using Microsoft Excel.

References

    1. Cawthon RM. Telomere measurement by quantitative PCR. Nucleic Acids Res. 2002;30:e47. - PMC - PubMed
    1. Sheffield VC, Cox DR, Lerman LS, Myers RM. Attachment of a 40-base-pair G+ C-rich sequence (GC-clamp) to genomic DNA fragments by the polymerase chain reaction results in improved detection of single-base changes. Proc. Natl Acad. Sci. USA. 1989;86:232–236. - PMC - PubMed
    1. Kainz P. The PCR plateau phase—towards an understanding of its limitations. Biochim. Biophys. Acta. 2000;1494:23–27. - PubMed
    1. Lawyer FC, Stoffel S, Saiki RK, Chang SY, Landre PA, Abramson RD, Gelfand DH. High-level expression, purification, and enzymatic characterization of full-length Thermus aquaticus DNA polymerase and a truncated form deficient in 5′ to 3′ exonuclease activity. PCR Methods Appl. 1993;2:275–287. - PubMed

Publication types