. 2009 Apr;37(5):1387-99.
doi: 10.1093/nar/gkn1069. Epub 2009 Jan 7.

Gene expression modulation is associated with gene amplification, supernumerary chromosomes and chromosome loss in antimony-resistant Leishmania infantum

Affiliations

Gene expression modulation is associated with gene amplification, supernumerary chromosomes and chromosome loss in antimony-resistant Leishmania infantum

Philippe Leprohon et al. Nucleic Acids Res. 2009 Apr.

Abstract

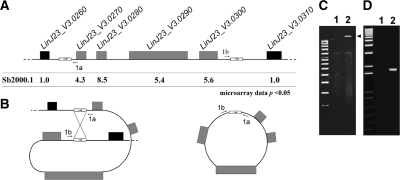
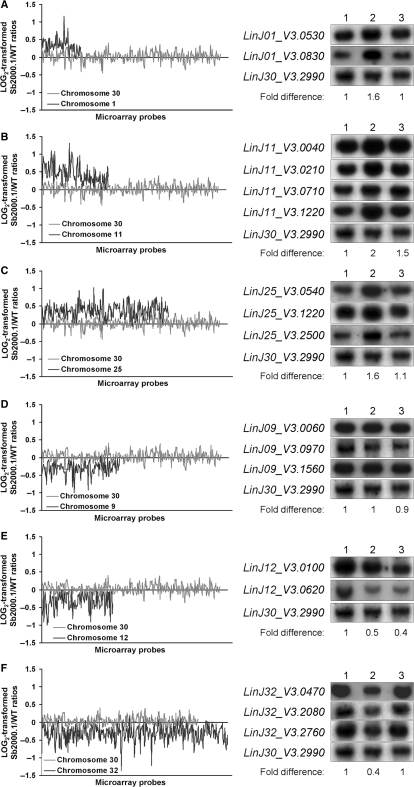
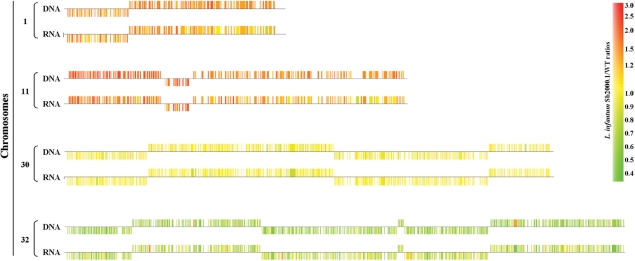
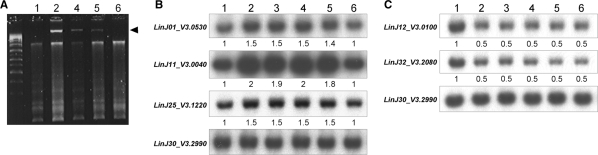
Antimonials remain the first line drug against the protozoan parasite Leishmania but their efficacy is threatened by resistance. We carried out a RNA expression profiling analysis comparing an antimony-sensitive and -resistant (Sb2000.1) strain of Leishmania infantum using whole-genome 70-mer oligonucleotide microarrays. Several genes were differentially expressed between the two strains, several of which were found to be physically linked in the genome. MRPA, an ATP-binding cassette (ABC) gene known to be involved in antimony resistance, was overexpressed in the antimony-resistant mutant along with three other tandemly linked genes on chromosome 23. This four gene locus was flanked by 1.4 kb repeated sequences from which an extrachromosomal circular amplicon was generated in the resistant cells. Interestingly, gene expression modulation of entire chromosomes occurred in the antimony-resistant mutant. Southern blots analyses and comparative genomic hybridizations revealed that this was either due to the presence of supernumerary chromosomes or to the loss of one chromosome. Leishmania parasites with haploid chromosomes were viable. Changes in copy number for some of these chromosomes were confirmed in another antimony-resistant strain. Selection of a partial revertant line correlated antimomy resistance levels and the copy number of aneuploid chromosomes, suggesting a putative link between aneuploidy and drug resistance in Leishmania.


Figures

Figure 1.
Figure 1.
Antimony susceptibilities in L. infantum. Growth of L. infantum promastigote cells in the presence of increasing concentrations of SbIII was monitored at 72 h by OD mesurements at 600 nm. The average of three experiments is shown. Leishmania infantum WT (open circles); L. infantum Sb2000.1 (filled circles); L. infantum Sb2000.1rev P30 (open squares); L. infantum Sb2000.1rev P30 transfected with pSPαNEOα-MRPA (filled squares).
Figure 2.
Figure 2.
Gene expression profiling of antimony-resistant L. infantum promastigotes. Plot of log2-transformed Sb2000.1/WT expression ratios as a function of hybridization intensities. An average of five independent experiments is presented. External lines and dashed lines indicate 2- and 1.5-fold differences, respectively.
Figure 3.
Figure 3.
Validation of DNA microarrays expression data by quantitative real-time RT-PCR (qRT-PCR). (A) The mean log2-transformed Sb2000.1/WT ratios of selected genes from microarrays expression data (black bars) are compared to qRT-PCR data (grey bars). (B) The mean log2-transformed Sb2000.1/WT (black bars) and Sb4000.4/WT (grey bars) qRT-PCR expression ratios of a group of selected genes. (C) The mean log2-transformed qRT-PCR expression ratios of LinJ05_V3.0830 and LinJ23_V3.0290 in different L. infantum antimony-resistant mutants compared to the parental WT strain. The qRT-PCR data were normalized with the LinJ18_V3.0630 and LinJ36_V3.0850 genes, for which a highly stable expression was noted in several conditions by different microarrays experiments. An asterix beside the bars indicates a significant fold difference (P < 0.05).
Figure 4.
Figure 4.
Chromosome map of L. infantum Sb2000.1/WT gene expression modulation. DNA microarrays data were analyzed with the GeneSpring GX3.1 software to illustrate the Sb2000.1/WT expression ratios on a chromosome map of L. infantum. Orange to red features indicate genes overexpressed in Sb2000.1, whereas pale to bright green features indicate genes downregulated in Sb2000.1. Yellow features indicate genes equally expressed in both samples. (Insert) Log2-transformed Sb2000.1/WT expression ratios plotted as a function of the chromosomal location of every probes represented on the full-genome microarrays from chromosome 1 (left end) to chromosome 36 (right end). Probes are plotted by coordinates along each chromosome. Vertical bars represent the log2-transformed expression ratio of individual genes. Whereas most of the genes represented by the microarrays do not show a modulated expression, some chromosomes are entirely overexpressed or downregulated at the RNA level. (A) chromosome 1; (B) chromosome 11; (C) overexpressed locus on chromosome 23; (D) chromosome 25; (E) chromosome 9; (F) chromosome 12; (G) chromosome 32. The plot represents the average values of five independent hybridizations.
Figure 5.
Figure 5.
Extrachromosomal circular amplification of a genomic region encoding the MRPA gene on chromosome 23 of Leishmania. (A) Genomic organization of the MRPA locus in L. infantum with the Sb2000.1/WT microarrays expression ratios indicated underneath. Direct repeats of 1.4 kb are indicated by small boxes and the approximate position of PCR primers 1a and 1b is indicated. (B) Model for the formation of the extrachromosomal circular DNA generated through homologous recombination between the direct repeats. (C) Isolation of a circular DNA amplicon by standard alkaline lysis preparation. The arrow head indicates the presence of the extrachromosomal circular DNA. (D) PCR amplification of a 1.8 kb DNA fragment with primers 1a and 1b to support the model shown in Figure 5B. For (C) and (D), L. infantum wild type (lane 1); L. infantum Sb2000.1 (lane 2).
Figure 6.
Figure 6.
Chromosome aneuploidy in L. infantum Sb2000.1 and Sb4000.4 antimony-resistant mutants. Log2-transformed Sb2000.1/WT expression ratios of the upregulated chromosome 1 (A), chromosome 11 (B) and chromosome 25 (C) and of the downregulated chromosome 9 (D), chromosome 12 (E) and chromosome 32 (F) plotted as a function of the location of microarray probes on each chromosomes. For each plot, the log2-transformed gene expression ratios of chromosome 30, which was equally expressed in both samples, are shown as a control (grey line). Quantitative Southern blot hybridizations of digested genomic DNA extracted from L. infantum WT (lane 1), Sb2000.1 (lane 2) and Sb4000.4 (lane 3) were performed to correlate gene expression modulation of entire chromosomes with the chromosome DNA copy number. The hybridization signal of LinJ30_V3.2990 was used for normalization. The hybridization signals were quantified using ImageQuant 5.2 (Molecular Dynamics) and the fold differences in DNA copy number of Sb2000.1 compared to WT are found below each blot.
Figure 7.
Figure 7.
Comparison of relative hybridization data between RNA expression profiling and CGH. RNA- or genomic DNA-derived probes were prepared from L. infantum Sb2000.1 and its sensitive parent strain and hybridized to DNA microarrays. A subset of whole chromosome comparisons showing the correlation between RNA and DNA hybridization data is shown. Examples shown are: chromosomes 1 and 11 showing increased RNA and DNA levels, chromosome 32 showing decreased RNA and DNA levels between the two strains and chromosome 30 where either RNA or DNA remained unchanged. The expression ratio of each gene is indicated as orange to red features for overexpressed genes, pale to bright green features for downregulated genes and yellow features for non-modulated genes.
Figure 8.
Figure 8.
Stability of the extrachromosomal circular amplicon and of chromosome aneuploidy in the revertant strain L infantum Sb2000.1rev. (A) Extrachromosomal circular amplicon isolated by alkaline lysis. The arrow head indicates the presence of the extrachromosomal circular DNA. (B) Quantitative Southern blot hybridizations of digested genomic DNA hybridized with probes specific to chromosomes 1, 11, 25 and 30 (as a control). (C) Quantitative Southern blot hybridizations of digested genomic DNA hybridized with probes specific to chromosomes 12, 32 and 30 (as a control). For (B) and (C), L. infantum WT (lane 1), L. infantum Sb2000.1 (lane 2), L. infantum Sb2000.1 grown for 5 (lane 3), 10 (lane 4), 20 (lane 5) and 30 (lane 6) passages in the absence of SbIII. The hybridization signals of LinJ30_V3.2990 located on a chromosome equally expressed between L. infantum WT and Sb2000.1 were used for normalization of Southern blot hybridization signals. Fold differences in hybridization intensities between L. infantum Sb2000.1 and WT are indicated below the Southern blots.
Figure 9.
Figure 9.
Monosomy of chromosome 32 in L. infantum Sb2000.1 and L. infantum Sb2000.1rev. (A) Genomic organization of the LinJ32_V3.2190 region. The LinJ32_V3.2190 upstream and downstream fragments that were used to carry out gene disruption are shown. The primers 1 and 2 used to confirm the integration of the inactivation cassette at the LinJ32_V3.2190 locus are shown. ‘H’ represents HindIII restriction sites. (B) PCR amplification to confirm the integration of the inactivation cassette. (C) Southern blot of L. infantum genomic DNA digested with HindIII and hybridized to a LinJ32_V3.2190 probe (top) or a LinJ30_V3.2990 probe as a control (bottom). For (B) and (C), L. infantum WT (lane 1), L. infantum WT with one LinJ32_V3.2190 allele disrupted (lane 2), L. infantum Sb2000.1 (lane 3), L. infantum Sb2000.1 with one LinJ32_V3.2190 allele disrupted (lane 4), L. infantum Sb2000.1rev P30 (lane 5), L. infantum Sb2000.1rev P30 with one LinJ32_V3.2190 allele disrupted (lane 6).

References

    1. Murray HW, Berman JD, Davies CR, Saravia NG. Advances in leishmaniasis. Lancet. 2005;366:1561–1577. - PubMed
    1. Hadighi R, Mohebali M, Boucher P, Hajjaran H, Khamesipour A, Ouellette M. Unresponsiveness to glucantime treatment in Iranian cutaneous leishmaniasis due to drug-resistant Leishmania tropica parasites. PLoS Med. 2006;3:e162. - PMC - PubMed
    1. Lira R, Sundar S, Makharia A, Kenney R, Gam A, Saraiva E, Sacks D. Evidence that the high incidence of treatment failures in Indian kala-azar is due to the emergence of antimony-resistant strains of Leishmania donovani. J. Infect. Dis. 1999;180:564–567. - PubMed
    1. Rojas R, Valderrama L, Valderrama M, Varona MX, Ouellette M, Saravia NG. Resistance to antimony and treatment failure in human Leishmania (Viannia) infection. J. Infect. Dis. 2006;193:1375–1383. - PubMed
    1. Croft SL, Sundar S, Fairlamb AH. Drug resistance in leishmaniasis. Clin. Microbiol. Rev. 2006;19:111–126. - PMC - PubMed

Publication types