. 2009 Mar;101(3):1660-70.
doi: 10.1152/jn.91062.2008. Epub 2009 Jan 7.

A simple quantitative method for analyzing electrographic status epilepticus in rats

Affiliations

A simple quantitative method for analyzing electrographic status epilepticus in rats

M J Lehmkuhle et al. J Neurophysiol. 2009 Mar.

Abstract

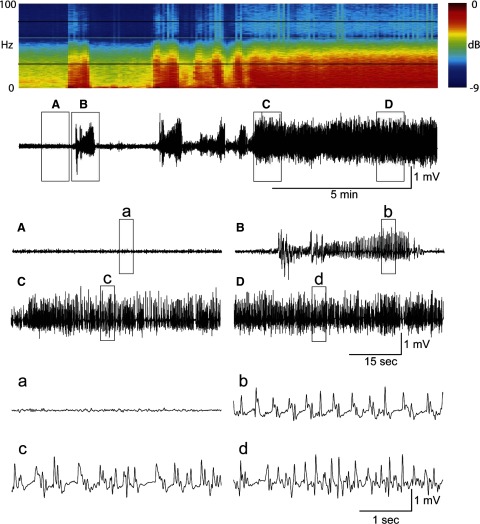
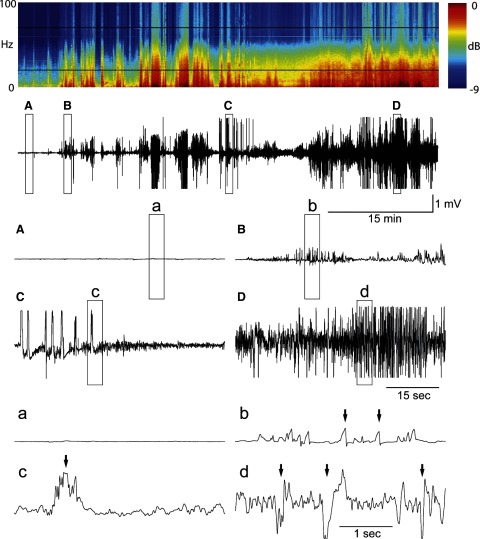
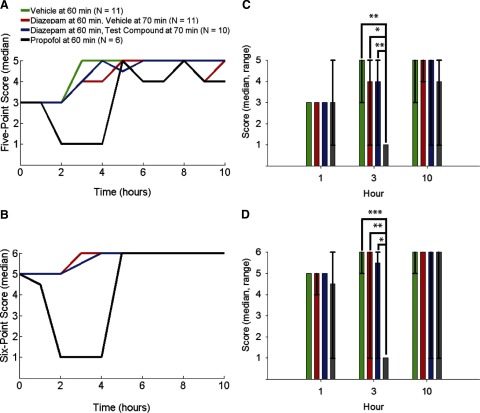
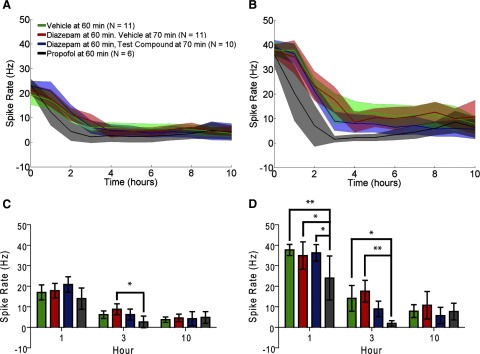
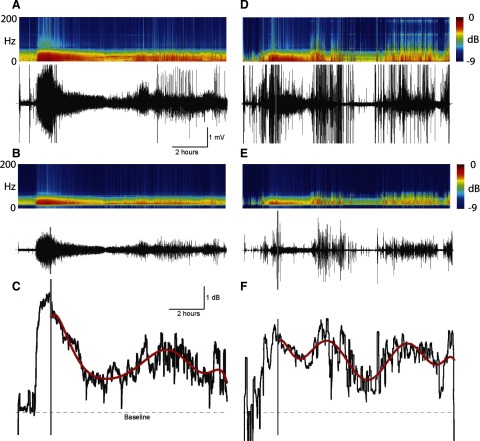
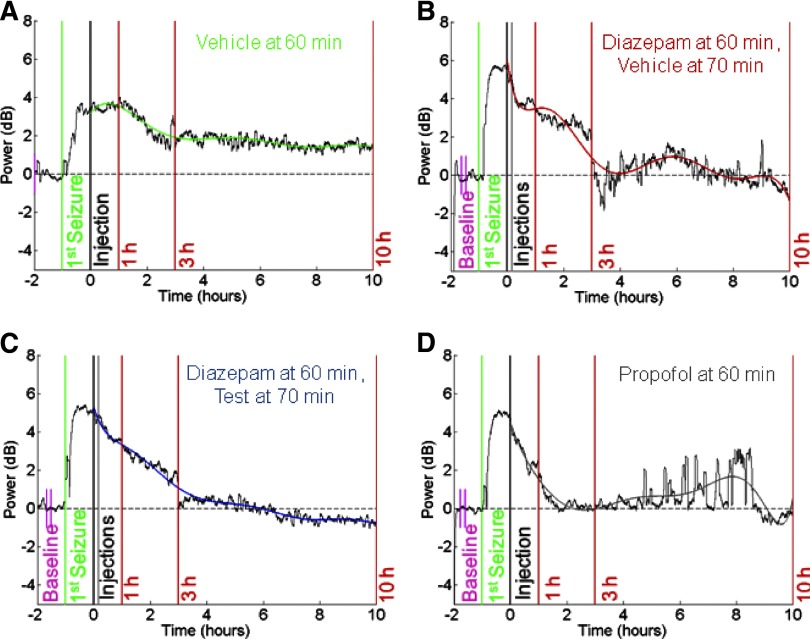
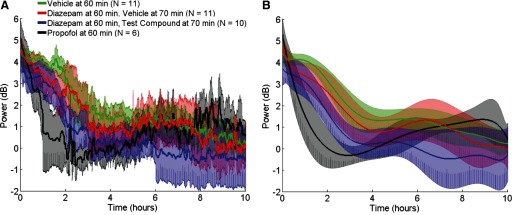
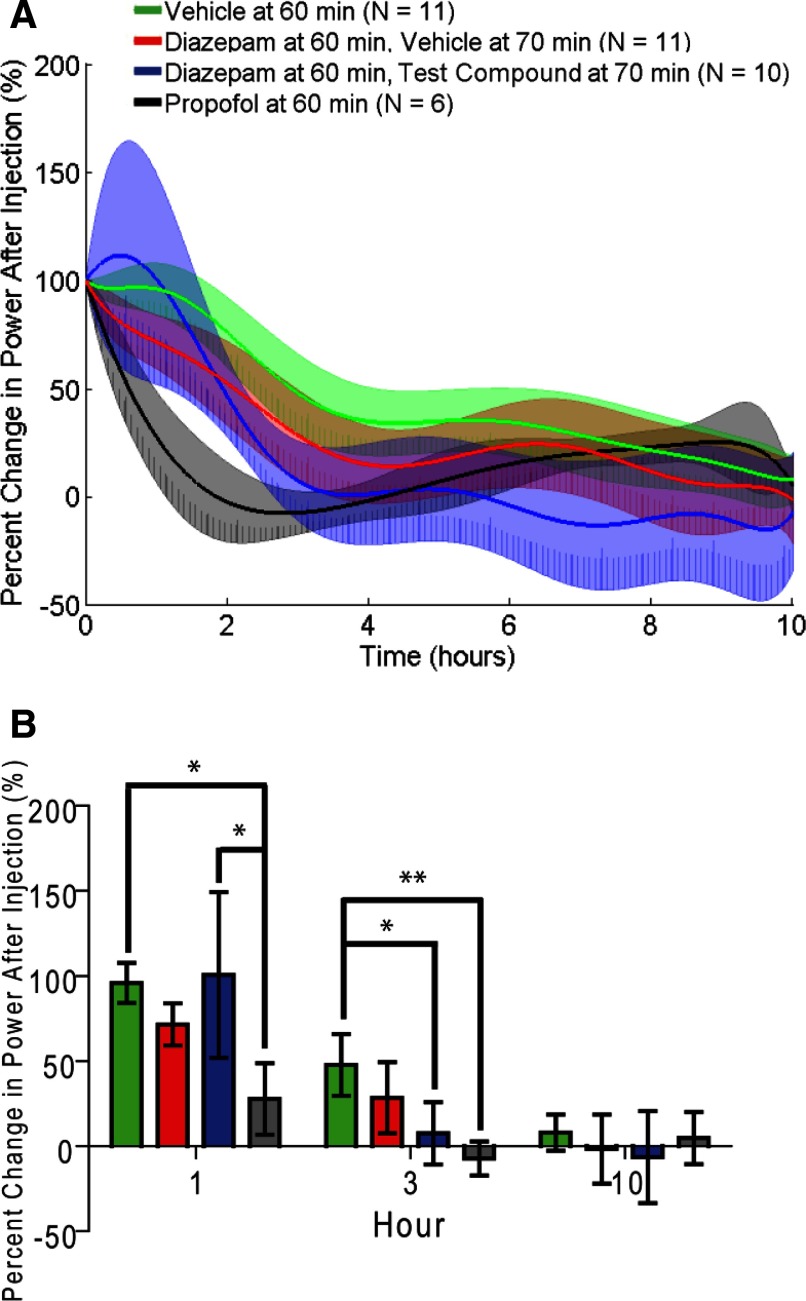
Electrographic status epilepticus (ESE) is a medical emergency consisting of repetitive seizures and may result in death or severe brain damage. Epilepsy can develop following ESE. The properties of ESE (e.g., duration and intensity) are variable, as are the effects of putative therapeutic treatments. Therefore a straightforward method to quantify different components of ESE would be beneficial for both researchers and clinicians. A frequency range close to the gamma band was selected for extraction of seizure-related activity from the EEG. This filtering strategy reduced motion artifacts and other noise sources in the electrophysiological recordings, thus increasing the signal-to-noise ratio of the EEG spike activity. EEG spiking was quantified using an energy operator and modeled by an eighth-order polynomial. In a benzodiazepine-resistant rat model of pilocarpine-induced ESE, the efficacy of various pharmaceutical agents at suppressing ESE was analyzed with this and other methods on data collected for < or =24 h after ESE induction. This approach allows for the objective, quantitative, and rapid assessment of the effects of both short- and long-lasting pharmacological manipulations on ESE and other forms of prolonged repetitive electrical activity.


Figures

FIG. 1.
FIG. 1.
Artifact-free electrographic status epilepticus (ESE). The raw EEG trace is 15 min long and was taken at the beginning of ESE after Li-pilocarpine treatment. At the top of the figure is the spectrogram (i.e., power spectrum over time) of the raw EEG. The light black bars bracket the γ-band frequencies (20–70 Hz) used in this study and show an increase in EEG power during ESE. Each box (A–D) shows 1-min enlargements of the data. These traces are further enlarged to 5-s (a–d). A: normal EEG before seizures. B: the 1st electrographic seizure. C: sample EEG trace during the beginning of ESE. D: sample EEG trace ∼5 min after the start of ESE. This trace represents raw (unfiltered) EEG that is free of movement and electrical artifacts.
FIG. 2.
FIG. 2.
Artifact-prone ESE. The format is similar to Fig. 1. The raw EEG trace is 60 min long and was taken at the beginning of ESE after Li-pilocarpine treatment from a different animal. This EEG recording contains numerous movement-induced artifacts, suggested by the arrows. A: normal EEG before seizures. B: the 1st electrographic seizure. C: sample EEG trace during seizure. D: sample EEG trace after the start of ESE. The voltage scale is conserved across traces.
FIG. 3.
FIG. 3.
Human evaluation of ESE. Data are the median of the human-scored ESE starting 1 h after the 1st motor seizure (the initial treatment injection, time = 0 h) in 1-h increments (±5 min) for 10 h. Individual data points are connected with lines for clarity and are not meant to represent a continuous function. A: “5-point” method. B: “6-point” method. Green trace shows vehicle (saline) injection delivered 60 min after the first motor seizure (n = 11). Red trace shows diazepam injection delivered 60 min after the 1st motor seizure followed by vehicle (saline) injection delivered 70 min after the 1st motor seizure (n = 11). Blue trace shows diazepam injection delivered 60 min after the 1st motor seizure followed by test compound injection 70 min after the 1st motor seizure (n = 10). Black trace shows propofol injection delivered 60 min after the 1st motor seizure (n = 6). C and D: Kruskal-Wallis ANOVA of the data in A and B at 1, 3, and 10 h after the initial treatment injection (median and range). *P < 0.05, **P < 0.01, and ***P < 0.001. Note the vehicle trace (green) in B follows and is obscured by the diazepam + vehicle trace (red). Human evaluation of ESE indicated the effectiveness of propofol treatment at reducing ESE to near baseline (determined before inducing ESE) levels. Kruskal-Wallis ANOVA suggested that the 5-point and 6-point methods closely match each other for describing changes in ESE over time.
FIG. 4.
FIG. 4.
Spike rate evaluation. Data are the mean and 95% CIs of the spike rate calculated in 1-h increments. A: raw EEG. B: EEG data filtered in the γ-band (20–70 Hz). Data groups are the same as in Fig. 3. C: data selection from A at 1, 3, and 10 h. D: data selection from B at 1, 3, and 10 h. *P < 0.05, **P < 0.01. Calculating spike rate from the raw EEG did not describe changes in ESE as well as human evaluation. Filtering the EEG in the γ-band improved the divisibility of the treatment groups, but identified differences in the 1st hour after treatment that were not identified by human evaluation. Filtered EEG spike rate did fail to detect a difference between propofol and diazepam plus test compound treatments observed in human evaluation.
FIG. 5.
FIG. 5.
Estimating artifact-free ESE with the model. A: data are the spectrogram (top) of an extended raw EEG recording (bottom) from Fig. 1. Note the frequency range on the spectrogram is wider than in Fig. 1. B: the raw EEG was filtered off-line between 20 and 70 Hz. C: data are the log10 power of the filtered EEG trace in B slid along in time in 5-min increments and adjusted to the EEG power in a 10-min window before pilocarpine injection (termed “baseline”; not shown). The sharp increase in power was characteristic of ESE. The gray bar indicates 60 min after the 1st motor seizure and was the time point of an injection of diazepam. Overlying the EEG power is an 8th-order polynomial estimation of the power of the EEG signal in response to the diazepam injection, referred to as the quantitative model of ESE (red trace). D: data are an extended raw EEG recording from Fig. 2. E: the filtered EEG. F: power of the filtered EEG trace in E. Format is similar to A–C. Filtering the signal reduced artifacts associated with convulsive movements, animal handling, and electrical artifacts such as harmonics of 60 cycle noise. Modeling of the EEG power with the polynomial reduced short-term fluctuations in EEG power, showing the overall temporal trend in the response to the treatment.
FIG. 6.
FIG. 6.
Quantitative modeling of ESE. Data (black traces) are the log10 power of a single EEG trace adjusted to baseline EEG power before pilocarpine injection (calculated between the short pink vertical bars). The sharp increase in power is indicative of ESE. Time 0 (black vertical bars) is 60 min after the 1st motor seizure (green vertical bars indicated) and is the time point of the 1st injection of (A) vehicle, (B) diazepam + vehicle 10 min later (2nd gray vertical bar), (C) diazepam + test compound 10 min later (2nd gray vertical bar), or (D) propofol. Overlying the EEG power is the quantitative model of ESE described in Fig. 5. Red vertical bars indicate 1, 3, and 10 h after the initial treatment injection (indicated). Data in each figure are representative of a single animal in each of the treatment categories. Note that baseline was calculated earlier than shown in A. These data show the varying temporal effects of each treatment on ESE. The polynomial allowed combining data from animals within each treatment group for comparisons across treatment groups.
FIG. 7.
FIG. 7.
γ-Band energy and model predictions. A: data are the mean (solid traces) and 95% CIs (shaded) of the γ-band energy for each of the treatments after the baseline (prepilocarpine) power has been removed and aligned to the initial treatment injection (time = 0). Format is similar to Figs. 3 and 4. B: data are the mean (solid traces) and 95% CIs (shaded) of model predictions for each of the treatments aligned to the initial treatment injection as a function of time. Data groups and format are the same as in A. These data show the effectiveness of propofol treatment at reducing ESE to prepilocarpine treatment levels, albeit for short periods.
FIG. 8.
FIG. 8.
Percent change in power following the initial injection treatment. A: data are the mean (solid traces) and 95% CIs (shaded) of model predictions for each of the treatments normalized to the power at the initial treatment injection. Data groups and format are the same as in Fig. 7. B: ANOVA of the data in A for all 4 conditions. *P < 0.05, **P < 0.01. The data show benzodiazepine-resistant ESE as indicated by marginal improvement in ESE power with diazepam treatment (compared with vehicle treatment) similar to human evaluation and filtered spike rate analysis. However, ANOVA suggested no difference between propofol treatment and diazepam treatment, an observation in disagreement with human evaluation and filtered spike rate analysis. Finally the quantitative model identified a significant difference between diazepam with test compound treatment and vehicle treatment. This last difference suggested that this particular test compound was effective with diazepam at reducing ESE, similar to propofol treatment, a potential improvement in benzodiazepine-resistant ESE.

References

    1. Adeli H, Zhou Z, Dadmehr N. Analysis of EEG records in an epileptic patient using wavelet transform. J Neurosci Methods 123: 69–87, 2003. - PubMed
    1. Andersen P, Bliss TV, Skrede KK. Unit analysis of hippocampal polulation spikes. Exp Brain Res Experimentelle Hirnforschung 13: 208–221, 1971. - PubMed
    1. Andersen P, Holmqvist B, Voorhoeve PE. Entorhinal activation of dentate granule cells. Acta Physiol Scand 66: 448–460, 1966. - PubMed
    1. Arboix A, Garcia-Eroles L, Massons JB, Oliveres M, Comes E. Predictive factors of early seizures after acute cerebrovascular disease. Stroke 28: 1590–1594, 1997. - PubMed
    1. Bautista RE, Godwin S, Caro D. Incorporating abbreviated EEGs in the initial workup of patients who present to the emergency room with mental status changes of unknown etiology. J Clin Neurophysiol 24: 16–21, 2007. - PubMed

Publication types

LinkOut - more resources