

Bulbar acetylcholine enhances neural and perceptual odor discrimination
- PMID: 19129384
- PMCID: PMC2768367
- DOI: 10.1523/JNEUROSCI.4036-08.2009
Bulbar acetylcholine enhances neural and perceptual odor discrimination
Abstract
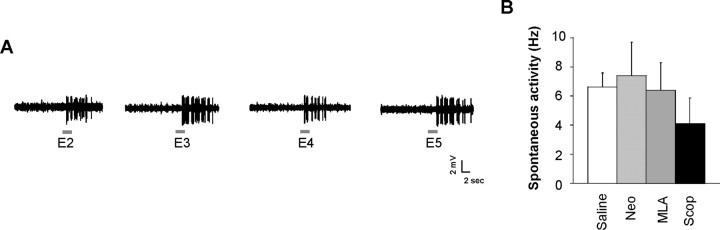
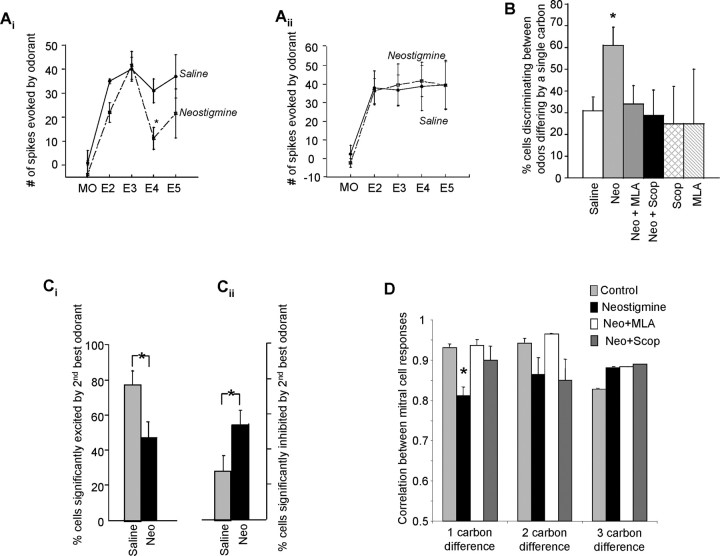
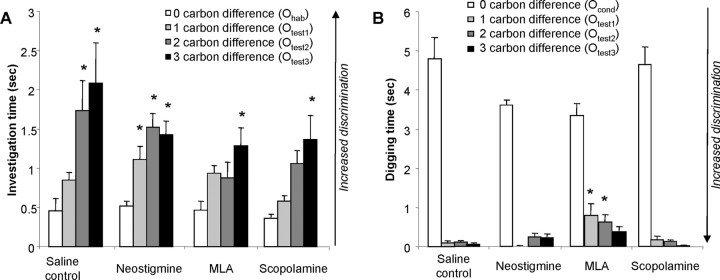
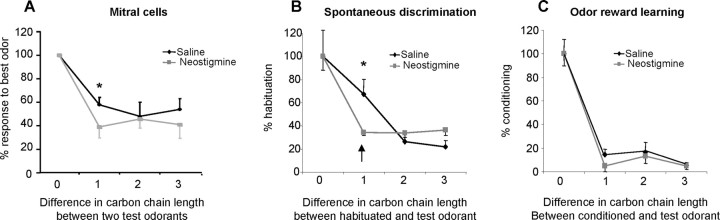
Experimental and modeling data suggest that the circuitry of the main olfactory bulb (OB) plays a critical role in olfactory discrimination. Processing of such information arises from the interaction between OB output neurons local interneurons, as well as interactions between the OB network and centrifugal inputs. Cholinergic input to the OB in particular has been hypothesized to regulate mitral cell odorants receptive fields (ORFs) and behavioral discrimination of similar odorants. We recorded from individual mitral cells in the OB in anesthetized rats to determine the degree of overlap in ORFs of individual mitral cells after exposure to odorant stimuli. Increasing the efficacy of the cholinergic neurotransmission in the OB by addition of the anticholinesterase drug neostigmine (20 mM) sharpened the ORF responses of mitral cells. Furthermore, coaddition of either the nicotinic antagonist methyllycaconitine citrate hydrate (MLA) (20 mM) or muscarinic antagonist scopolamine (40 mM) together with neostigmine (20 mM) attenuated the neostigmine-dependent sharpening of ORFs. These electrophysiological findings are predictive of accompanying behavioral experiments in which cholinergic modulation was manipulated by direct infusion of neostigmine, MLA, and scopolamine into the OB during olfactory behavioral tasks. Increasing the efficacy of cholinergic action in the OB increased perceptual discrimination of odorants in these experiments, whereas blockade of nicotinic or muscarinic receptors decreased perceptual discrimination. These experiments show that behavioral discrimination is modulated in a manner predicted by the changes in mitral cell ORFs by cholinergic drugs. These results together present a first direct comparison between neural and perceptual effects of a bulbar neuromodulator.
Figures
Similar articles
-
Cholinergic modulation in the olfactory bulb influences spontaneous olfactory discrimination in adult rats.Eur J Neurosci. 2006 Dec;24(11):3234-44. doi: 10.1111/j.1460-9568.2006.05212.x. Eur J Neurosci. 2006. PMID: 17156384
-
Noradrenergic but not cholinergic modulation of olfactory bulb during processing of near threshold concentration stimuli.Behav Neurosci. 2012 Oct;126(5):720-8. doi: 10.1037/a0030006. Behav Neurosci. 2012. PMID: 23025834 Free PMC article.
-
Distinct roles of bulbar muscarinic and nicotinic receptors in olfactory discrimination learning.J Neurosci. 2014 Aug 20;34(34):11244-60. doi: 10.1523/JNEUROSCI.1499-14.2014. J Neurosci. 2014. PMID: 25143606 Free PMC article.
-
Odor perception and olfactory bulb plasticity in adult mammals.J Neurophysiol. 2009 May;101(5):2204-9. doi: 10.1152/jn.00076.2009. Epub 2009 Mar 4. J Neurophysiol. 2009. PMID: 19261715 Review.
-
Odor representation and coding by the mitral/tufted cells in the olfactory bulb.J Zhejiang Univ Sci B. 2024 Oct 15;25(10):824-840. doi: 10.1631/jzus.B2400051. J Zhejiang Univ Sci B. 2024. PMID: 39420520 Free PMC article. Review.
Cited by
-
Organization and engagement of a prefrontal-olfactory network during olfactory selective attention.Cereb Cortex. 2023 Feb 7;33(4):1504-1526. doi: 10.1093/cercor/bhac153. Cereb Cortex. 2023. PMID: 35511680 Free PMC article.
-
Olfactory bulb acetylcholine release dishabituates odor responses and reinstates odor investigation.Nat Commun. 2018 May 14;9(1):1868. doi: 10.1038/s41467-018-04371-w. Nat Commun. 2018. PMID: 29760390 Free PMC article.
-
Sleep and olfactory cortical plasticity.Front Behav Neurosci. 2014 Apr 22;8:134. doi: 10.3389/fnbeh.2014.00134. eCollection 2014. Front Behav Neurosci. 2014. PMID: 24795585 Free PMC article. Review.
-
Internal Cholinergic Regulation of Learning and Recall in a Model of Olfactory Processing.Front Cell Neurosci. 2016 Nov 8;10:256. doi: 10.3389/fncel.2016.00256. eCollection 2016. Front Cell Neurosci. 2016. PMID: 27877112 Free PMC article.
-
Preservation of Essential Odor-Guided Behaviors and Odor-Based Reversal Learning after Targeting Adult Brain Serotonin Synthesis.eNeuro. 2016 Nov 17;3(5):ENEURO.0257-16.2016. doi: 10.1523/ENEURO.0257-16.2016. eCollection 2016 Sep-Oct. eNeuro. 2016. PMID: 27896310 Free PMC article.
References
-
- Bathellier B, Lagier S, Faure P, Lledo PM. Circuit properties generating gamma oscillations in a network model of the olfactory bulb. J Neurophysiol. 2006;95:2678–2691. - PubMed
-
- Cleland TA, Linster C. Computation in the olfactory system. Chem Senses. 2005;30:801–813. - PubMed
-
- Cleland TA, Narla VA. Intensity modulation of olfactory acuity. Behav Neurosci. 2003;117:1434–1440. - PubMed
Publication types
MeSH terms
Substances
Grants and funding
LinkOut - more resources
Full Text Sources
Miscellaneous