. 2009 Jan 7;29(1):86-97.
doi: 10.1523/JNEUROSCI.4105-08.2009.

Sensory input enhances synaptogenesis of adult-born neurons

Affiliations

Sensory input enhances synaptogenesis of adult-born neurons

Yoav Livneh et al. J Neurosci. .

Abstract

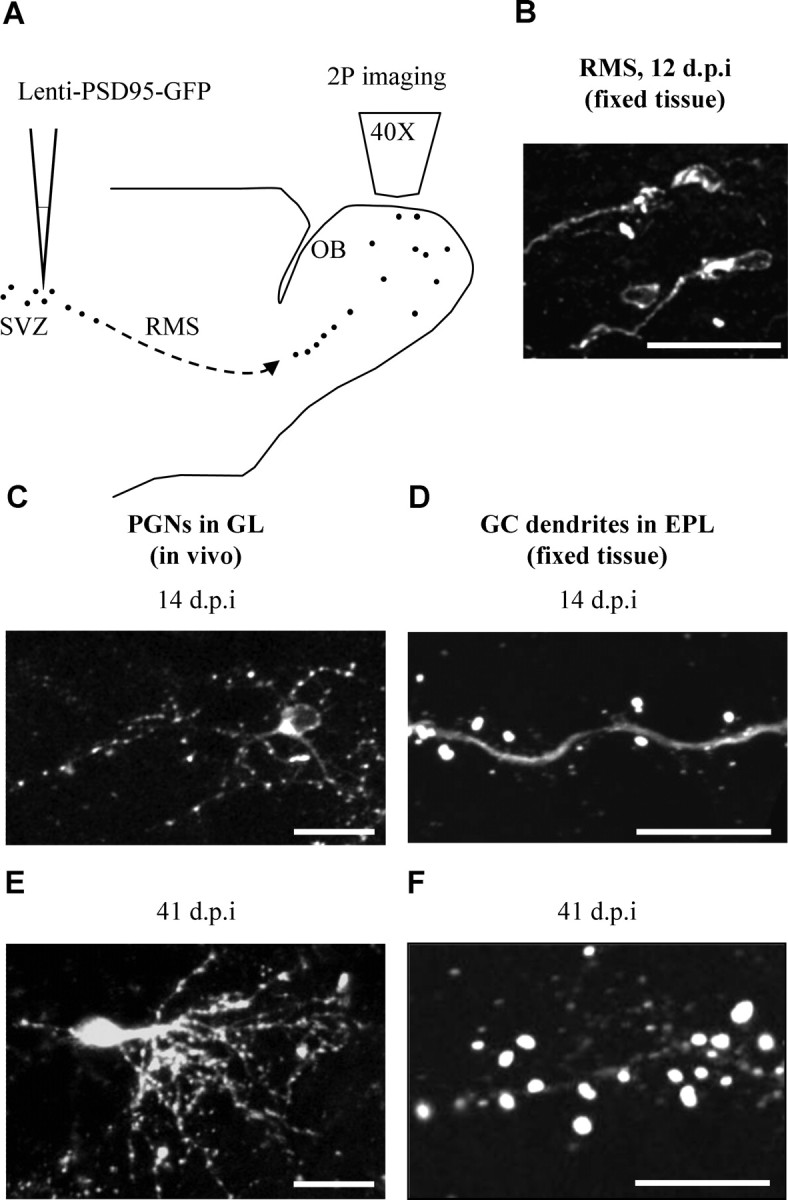
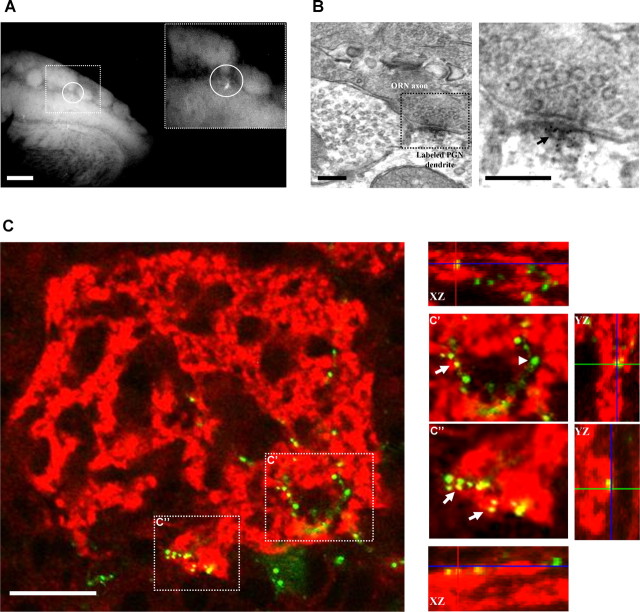
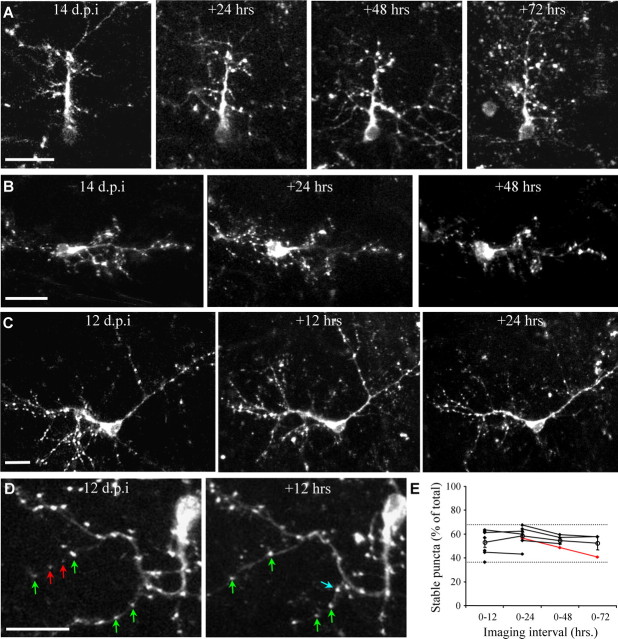
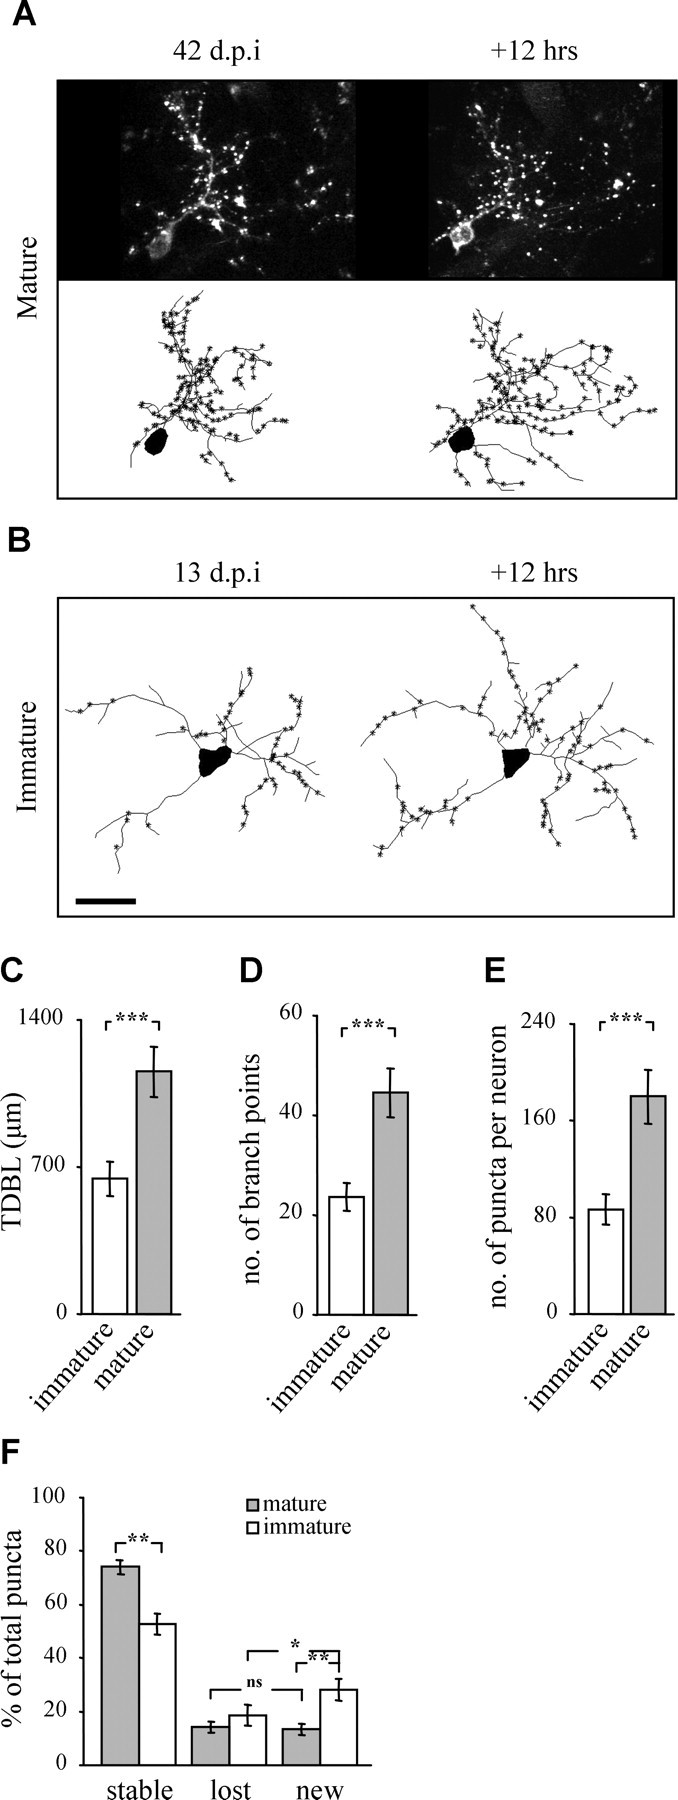
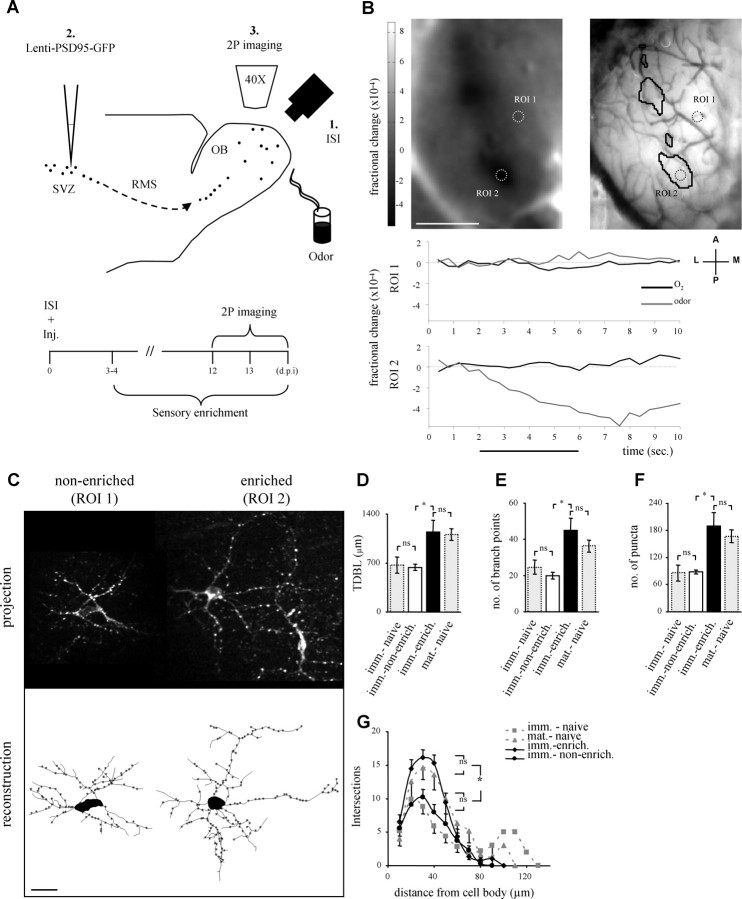
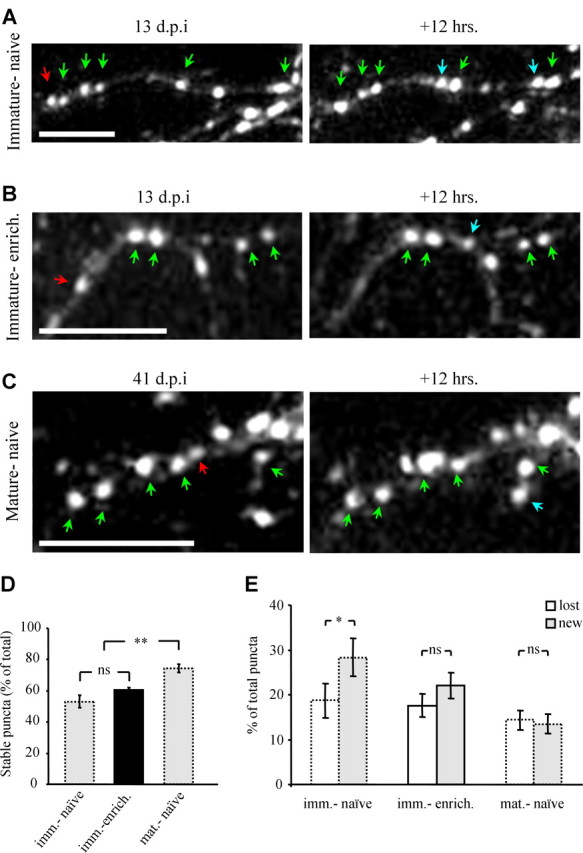
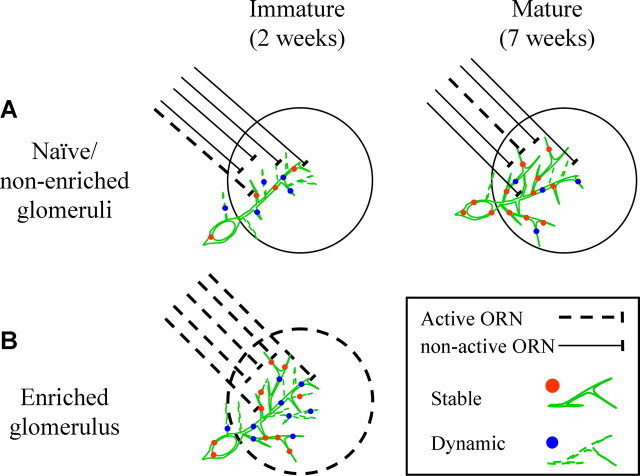
The adult mammalian brain maintains a prominent stem cell niche in the subventricular zone supplying new neurons to the olfactory bulb. We examined the dynamics of synaptogenesis by imaging the formation and elimination of clusters of a postsynaptic marker (PSD95), genetically targeted to adult-born neurons. We imaged in vivo adult-born periglomerular neurons (PGNs) during two phases of development, immaturity and maturity. Immature PGNs showed high levels of PSD95 puncta dynamics during 12-72 h intervals. Mature PGNs were more stable compared with immature PGNs but still remained dynamic, suggesting that synaptogenesis persists long after these neurons integrated into the network. By combining intrinsic signal and two photon imaging we followed PSD95 puncta in sensory enriched glomeruli. Sensory input upregulated the development of adult-born PGNs only in enriched glomeruli. Our data provide evidence for an activity-based mechanism that enhances synaptogenesis of adult-born PGNs during their initial phases of development.


Figures

Figure 1.
Figure 1.
Targeting synapses of adult-born neurons using lenti-PSD95-GFP. A, Schematic representation of the mouse brain and the experimental protocol. Lenti-PSD95-GFP injections were targeted to the subventricular zone (SVZ), and imaging was performed at different times after injections, using two-photon (2P) imaging. B, Confocal micrograph of labeled neurons from the RMS, exhibiting the morphology of migrating neuroblasts. C, In vivo two-photon micrograph of an immature PSD95-GFP-expressing PGN in the GL (14 d.p.i.). Notice that the dendritic trees are studded with punctuate fluorescent signals, corresponding to PSD95-GFP protein aggregations. D, Confocal micrograph of a dendritic segment from an immature PSD95-GFP-expressing GC in the GCL (14 d.p.i.). Notice that the PSD95-GFP signal is mainly in spine heads. E, In vivo two-photon micrograph of a mature PSD95-GFP-expressing PGN in the GL (41 d.p.i.). F, Confocal micrograph of a dendritic segment from a mature PSD95-GFP-expressing GC in the EPL (41 d.p.i.). All images are projections. Scale bars: (B, C, E) 20 μm; (D, F) 10 μm.
Figure 2.
Figure 2.
PSD95-GFP puncta as proxy for synapses. A, B, Targeting of PSD95-GFP-expressing PGNs for TEM analysis. A, PSD95-GFP-labeled PGNs (circled in A) were located in a fluorescent microscope under low resolution. A smaller area was then mechanically isolated (inset) and processed for anti-GFP immuno-TEM. Scale bar, 200 μm. B, Electron micrograph of a labeled synapse from the isolated area shown in A. The dark-grained aggregate in the magnified view (arrow) is located within a dendrite and is contacted by a presynaptic ORN axon terminal. Scale bars, 200 nm. C, Confocal micrographs of a single glomerulus (single optical sections). Red, Labeling of an ORN-specific presynaptic marker (VGLUT2); green, a PSD95-GFP-expressing PGN (14 d.p.i.). The images on the right are magnifications from the dashed square regions in the left image. Note appositions (yellow; arrows) between presynaptic ORN terminals and postsynaptic PSD95-GFP puncta. Not all puncta were opposed to this presynaptic marker (green; arrowheads). Scale bar, 20 μm.
Figure 3.
Figure 3.
PSD95-GFP dynamics of immature adult-born PGNs at different imaging intervals. A–D, Projection images from consecutive in vivo imaging sessions 24 h apart (A, B) and 12 h apart. C, D, Examples of stable, lost, and new puncta are marked with green, red and blue arrows, respectively (same neuron as in supplemental Movie 1, available at www.jneurosci.org as supplemental material). E, Quantitative analysis of puncta dynamics, at different imaging intervals. For clarity, only the percentage of stable puncta (out of the total number) is shown. Full range is indicated by the dashed lines, open circles indicate means (n = 11 neurons, from 6 mice). Isolated points (not connected to a line) are from neurons which were only imaged twice. Lines connect consecutive sessions from the same neuron. For example, the red line shows data of the neuron in A, which was imaged four times. The percentage of stable, new, and lost puncta were not significantly different between all imaging intervals (Kruskal–Wallis test; stable puncta: p = 0.32, lost puncta: p = 0.38, new puncta: p = 0.35). Neurons imaged at 12, 13 or 14 d.p.i. had similar values of stable, lost, and new puncta. All values are mean ± SEM. Scale bars, 20 μm.
Figure 4.
Figure 4.
Maturation of adult-born PGNs: morphology and puncta dynamics. A, Time-lapse images of a mature adult-born PGN (42 d.p.i.). Top: Projections, bottom: reconstructions. Asterisks denote the location of PSD95-GFP puncta along the dendrite. B, Reconstructions of time-lapse images of an immature adult-born PGN (13 d.p.i.). Scale bar, 20 μm. C–E, Morphometric comparison of immature and mature adult-born PGNs. Bar graphs of the total dendritic branch length (TDBL) (C), number of branch points (D), and the total number of puncta per neuron (E). n = 10 immature PGNs from 5 mice, and 7 mature PGNs from 6 mice. F, Analysis of puncta dynamics. Mature PGNs had significantly more stable puncta and significantly less new puncta. Furthermore, immature PGNs had a significantly higher percentage of new puncta than lost. In contrast, mature PGNs had a similar percentage of new and lost puncta. n = 7 immature PGNs from 4 mice, and 5 mature PGNs from 3 mice. All values are mean ± SEM *p < 0.04, **p < 0.005, ***p < 0.001 (Mann–Whitney test).
Figure 5.
Figure 5.
Local sensory input upregulates adult-born PGN development. A, Schematic representation of the experimental protocol (top) and time course of the ISI-targeted 2P imaging experiment (bottom). Inj., Lentivirus injection into the SVZ. B, C, A representative ISI-2P experiment. B, Odor map (top left), and blood vessel map (top right), of the intrinsic signal response to the odor mixture (IS-active domains are circled in black in the blood vessel map). Two regions of interest (ROIs), containing the neurons shown in C, are circled in both maps. ROI 1 is in an IS-nonactive domain, whereas ROI 2 is within an IS-active domain. Bottom, The intrinsic signal time course of a single trial in ROIs 1 and 2. Notice the intrinsic signal response in ROI 2, but no response in ROI 1. Black trace, Pure oxygen; gray trace, odor. Horizontal black line shows the stimulus duration (4 s). A, Anterior; P, posterior; L, lateral; M, medial; scale bar, 1 mm. C, Two adult-born PGNs from the same experiment shown in B, one from a nonenriched domain (IS-nonactive, ROI 1) and another from an enriched domain (IS-active, ROI 2). Top, Maximum projection images of the original Z-stacks. Bottom, Two-dimensional view of the reconstructed neurons at the top. Scale bar, 20 μm. D–G, Quantitative morphological comparisons of neurons from enriched domains and nonenriched domains (black and white bars, respectively). Neurons from enriched domains had significantly greater total dendritic branch length (TDBL) (D), number of branch points (E), and number of puncta per neuron (F). G, Sholl analysis, showing that the significant differences between neurons in enriched domains versus those in nonenriched domains, were centered between 20–50 μm from the cell body. All higher values of enriched neurons were similar to those of mature neurons from naive mice (dashed gray bars and lines). The lower values of neurons from nonenriched domains were similar to those of immature neurons from naive mice (dashed gray bars and lines). n = 9 PGNs in enriched domains and n = 8 PGNs in nonenriched domains. Morphological data of immature and mature neurons from naive mice are the same as in Figure 4, and are presented here as dashed gray bars and lines. All values are mean ± SEM, *p < 0.001 (Kruskal–Wallis test, followed by Mann–Whitney test). Imm.-naive, Immature PGNs from naive mice; mat.-naive, mature PGNs from naive mice; imm.-enrich., immature PGNs from enriched domains in enriched mice; imm.-nonenrich., immature PGNs from nonenriched domains in enriched mice.
Figure 6.
Figure 6.
Dynamics of odor-enriched adult-born PGNs compared with immature and mature adult-born PGNs. A–C, Images of PSD95-GFP puncta from 12 h time-lapse sequences, in vivo. Immature PGN from a naive mouse (A), an immature PGN from an enriched domain (B), and a mature PGN from a naive mouse (C). Examples of stable, lost, and new puncta are marked with green, red and blue arrows, respectively. D, Bar graphs showing the levels of stable puncta which is higher in mature PGNs. E, Bar graphs of puncta dynamics. In contrast to immature PGNs from naive mice, mature PGNs and immature PGNs from enriched domains had similar values of new and lost puncta. n = 5 immature PGNs from enriched domains, from 3 mice. All values are mean ± SEM, *p < 0.04, **p < 0.003 (Kruskal–Wallis test and Mann–Whitney test). Note that data of puncta dynamics of immature and mature neurons from naive mice is the same as in Figure 4 (dotted bars). Scale bars, 10 μm. Imm.-naive, Immature PGNs from naive mice; mat.-naive, mature PGNs from naive mice; imm.-enrich., immature PGNs from enriched domains in enriched mice.
Figure 7.
Figure 7.
Schematic model of the developmental upregulation induced by sensory enrichment. A, Under animal facility conditions, most glomeruli will not be robustly activated by the odor environment of the animal (notice only few active ORNs). Under these conditions, adult-born PGNs gradually grow and stabilize while they integrate into the network. B, Sensory input will induce highly robust neuronal activity from ORNs in select glomeruli. Under these conditions, dendritic and synaptic dynamics are changed resulting in an increase of the total numbers of dendrites and synapses. See Discussion.

References

    1. Alonso M, Viollet C, Gabellec MM, Meas-Yedid V, Olivo-Marin JC, Lledo PM. Olfactory discrimination learning increases the survival of adult-born neurons in the olfactory bulb. J Neurosci. 2006;26:10508–10513. - PMC - PubMed
    1. Altman J. Autoradiographic and histological studies of postnatal neurogenesis. 3. Dating the time of production and onset of differentiation of cerebellar microneurons in rats. J Comp Neurol. 1969;136:269–293. - PubMed
    1. Alvarez-Buylla A, Garcia-Verdugo JM. Neurogenesis in adult subventricular zone. J Neurosci. 2002;22:629–634. - PMC - PubMed
    1. Bagley J, LaRocca G, Jimenez DA, Urban NN. Adult neurogenesis and specific replacement of interneuron subtypes in the mouse main olfactory bulb. BMC Neurosci. 2007;8:92. - PMC - PubMed
    1. Belenky MA, Smeraski CA, Provencio I, Sollars PJ, Pickard GE. Melanopsin retinal ganglion cells receive bipolar and amacrine cell synapses. J Comp Neurol. 2003;460:380–393. - PubMed

Publication types

MeSH terms

LinkOut - more resources