. 2009 Jan 7;29(1):118-30.
doi: 10.1523/JNEUROSCI.3985-08.2009.

Loss of modifier of cell adhesion reveals a pathway leading to axonal degeneration

Affiliations

Loss of modifier of cell adhesion reveals a pathway leading to axonal degeneration

Qi Chen et al. J Neurosci. .

Abstract

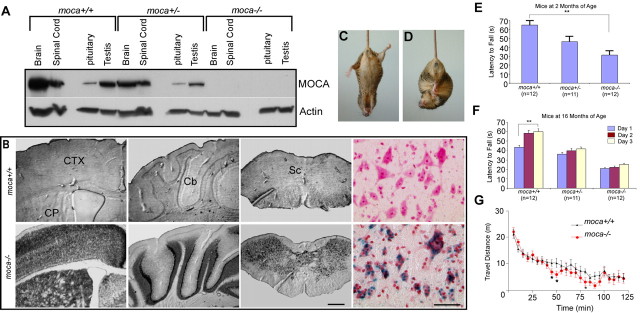
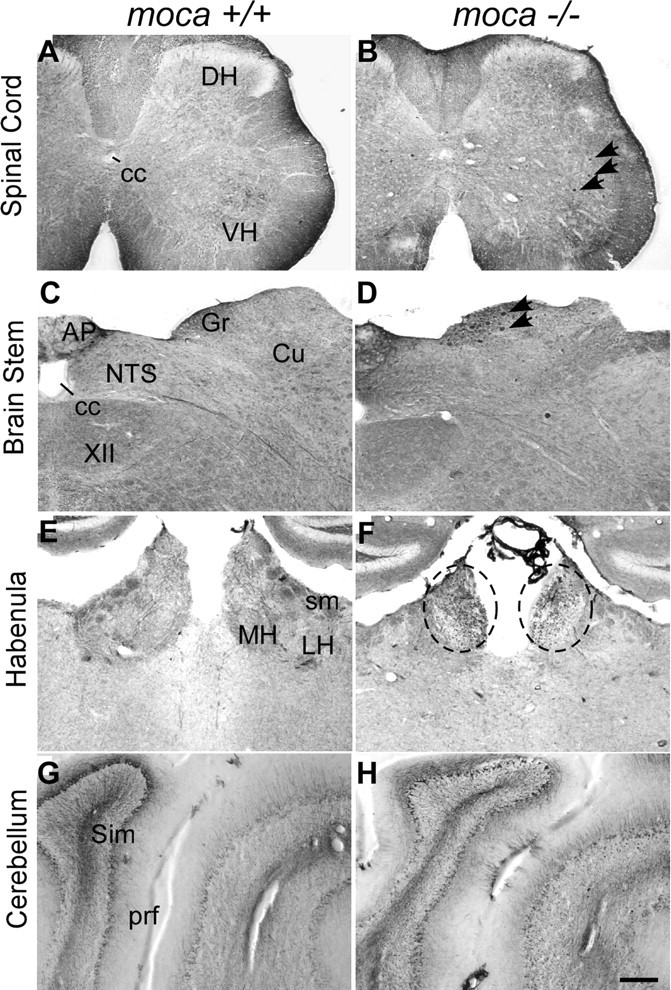
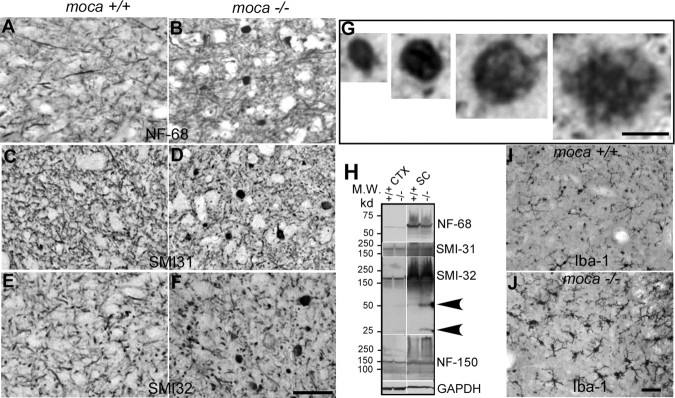
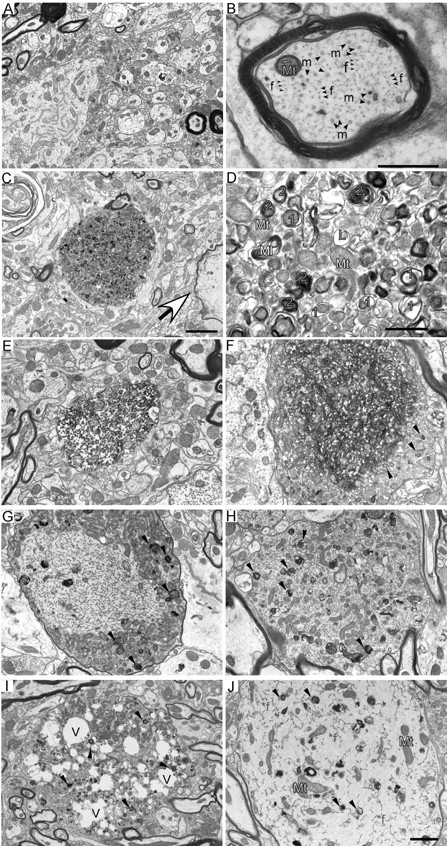
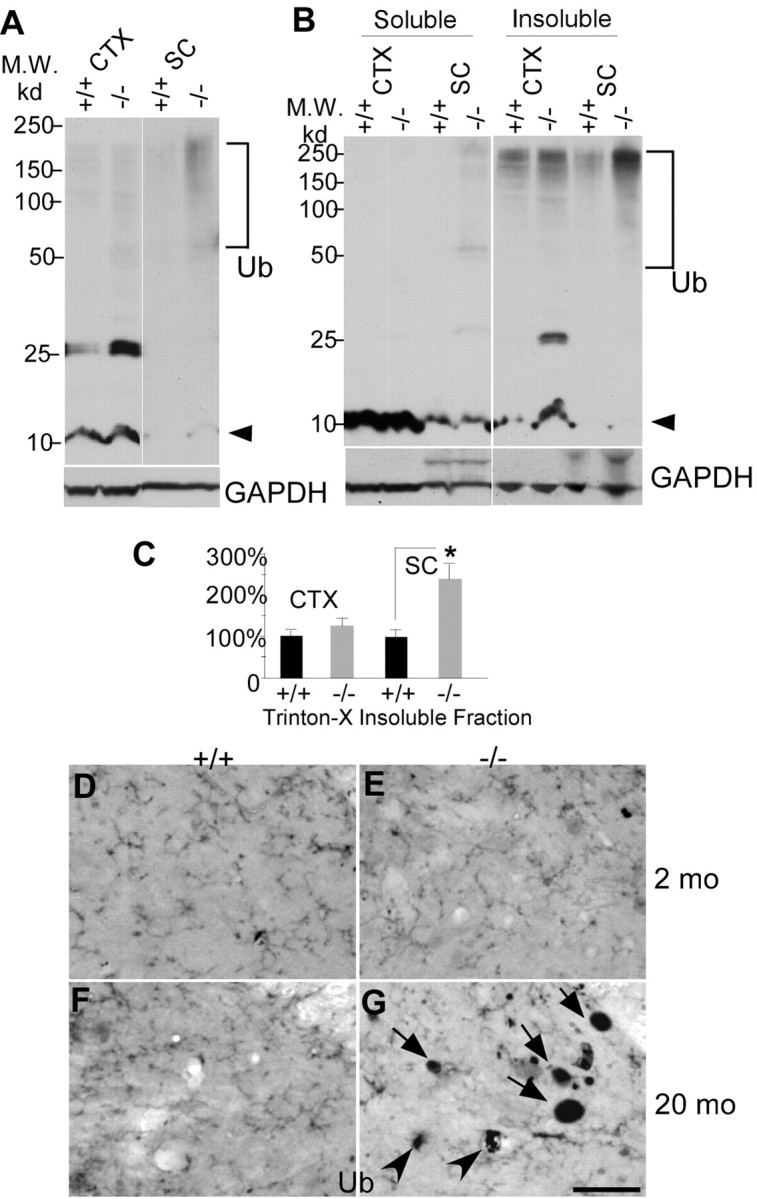
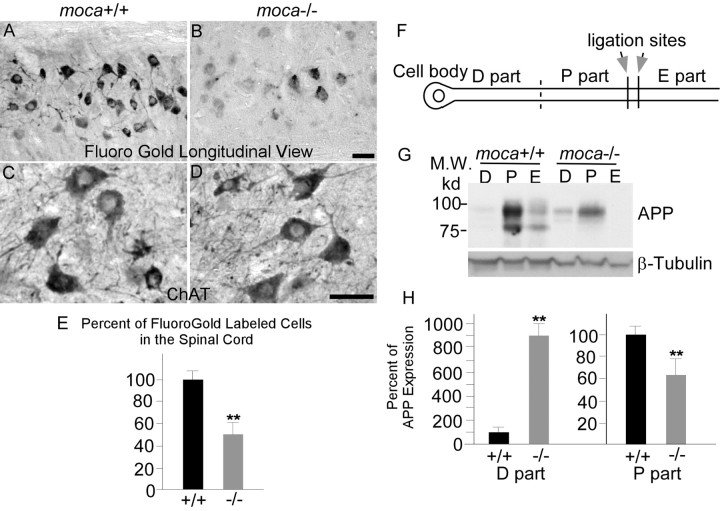
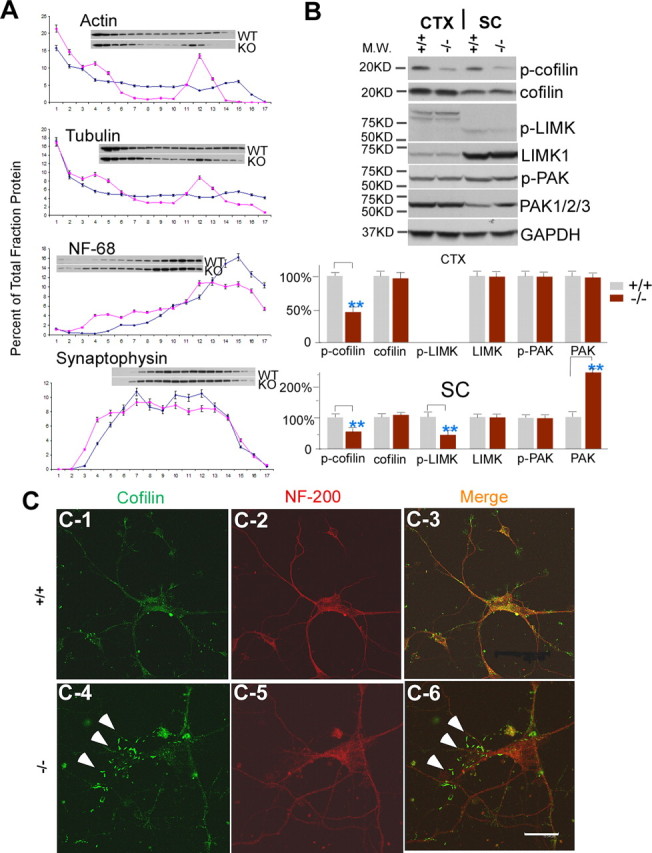
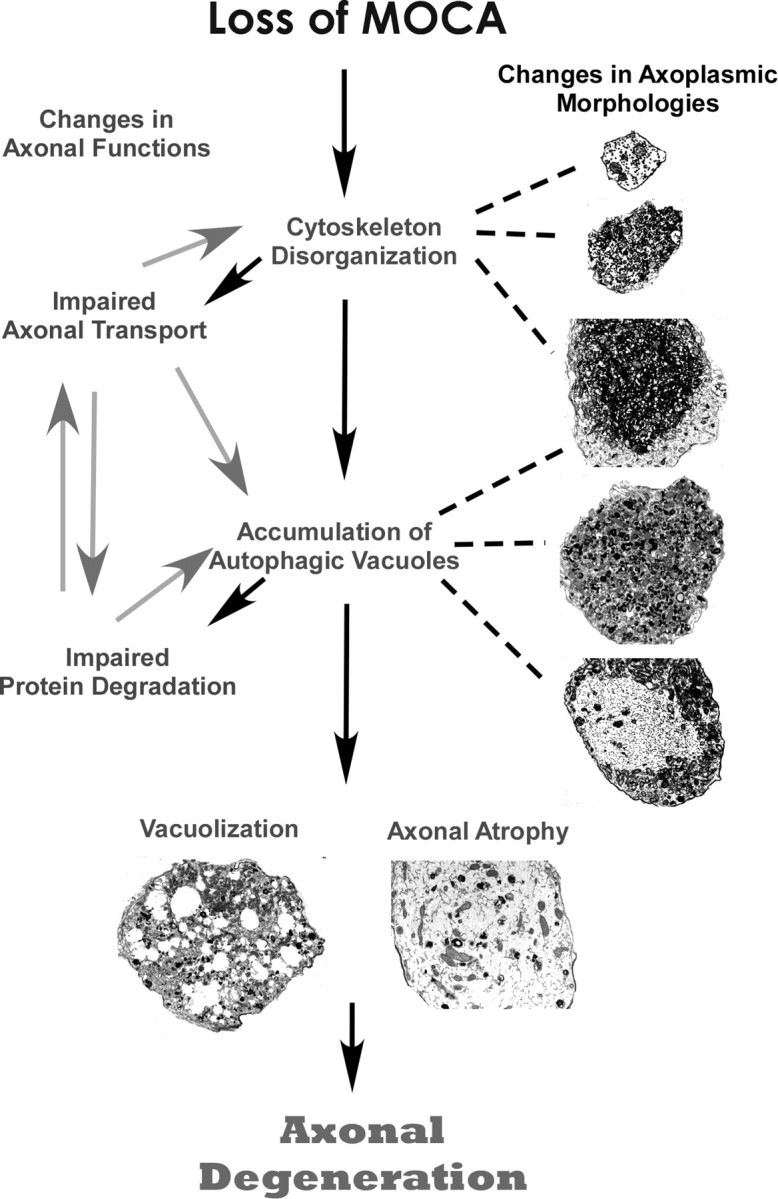
Axonal dysfunction is the major phenotypic change in many neurodegenerative diseases, but the processes underlying this impairment are not clear. Modifier of cell adhesion (MOCA) is a presenilin binding protein that functions as a guanine nucleotide exchange factor for Rac1. The loss of MOCA in mice leads to axonal degeneration and causes sensorimotor impairments by decreasing cofilin phosphorylation and altering its upstream signaling partners LIM kinase and p21-activated kinase, an enzyme directly downstream of Rac1. The dystrophic axons found in MOCA-deficient mice are associated with abnormal aggregates of neurofilament protein, the disorganization of the axonal cytoskeleton, and the accumulation of autophagic vacuoles and polyubiquitinated proteins. Furthermore, MOCA deficiency causes an alteration in the actin cytoskeleton and the formation of cofilin-containing rod-like structures. The dystrophic axons show functional abnormalities, including impaired axonal transport. These findings demonstrate that MOCA is required for maintaining the functional integrity of axons and define a model for the steps leading to axonal degeneration.


Figures

Figure 1.
Figure 1.
Expression of MOCA in the CNS and behavioral phenotypes of the moca−/− mouse line. A, The expression of MOCA in the wild-type, hemizygous, and homozygous knock-out mice. B, The expression of β-galactosidase in several representative brain structures of the wild-type (top) and homozygous knock-out (bottom) mice, including the motor cortex (CTX), caudate putamen (CP), cerebellum (Cb), and spinal cord (Sc). The last panel shows the β-gal expression pattern in the ventral horn of the spinal cord (blue) counterstained with neutral red. Scale bar, 500 μm (left three panels) or 50 μm (the right color panel). C, D, A clasping phenotype is shown in a mutant mouse (moca−/−) at the age of 20 months when its tail is lifted (D), a behavior that is not present in control (C). E, Motor performance was assessed by the rotarod test. The average time on the rod for each mouse group (2 months of age) is shown as the mean ± SD. Statistical analysis was performed by one-way ANOVA (F = 18, **p < 0.01). F, The motor learning ability was measured by continuing the training of the mice on rotarod performance. Four trials were performed daily for three consecutive days using three groups of animals at the age of 16 months. Data are presented as the mean ± SD. The data were subjected to a mixed ANOVA in which days were considered the repeated measure. Only the control group at the age of 16 months shows a significant difference (F = 4.42; **p = 0.02). G, The difference of the locomotor activities in the mutant and control mice was assessed by an open field test. The travel distance in every 5 min for each mouse group (2 months, n = 12) is shown as the mean ± SD. The statistics were performed by a Wilcoxon signed ranks test for related samples. *p < 0.05.
Figure 2.
Figure 2.
A–G, Abnormal axonal swellings/spheroids (indicated by arrows or circles) stained by an antibody against NF-68 are present in the spinal cord (B), the dorsal column of the brainstem (D), the habenula of moca−/− mice (F), and the cerebellum (H), but not in the corresponding areas of control mice (A, C, E, G). DH, Dorsal column; VH, ventral column; cc, central canal; AP, area postrema; Gr, gracile nucleus; Cu, cuneate nucleus; NTS, nucleus of the solitary tract; XII, hypoglossal nucleus; MH, medial habenular nucleus; LH, lateral habenular nucleus; sm, stria medullaris; prf, primary fissure; Sim, simple lobule. Scale bar, 200 μm.
Figure 3.
Figure 3.
A–J, Abnormal axonal swellings/spheroids representing degenerative axons are present in the spinal cord of moca−/− mice at the age of 20 months (B, D, F) but not in the age-matched controls (A, C, E). These abnormal axonal spheroids contain aggregates of neurofilaments. The coronal sections of the spinal cord are stained with different neurofilament antibodies including NF-68 (A, B), which recognizes the NF light chain; SMI-31 (C, D), which recognizes phosphorylated NF heavy chain; and SMI-32 (E, F), which recognizes nonphosphorylated NF heavy chain. G, Closer views of axonal spheroids of different sizes. H, Western blotting patterns of NFs from different brain regions of control (+/+) and moca−/− (−/−) mice. CTX, cerebral cortex; STR, striatum; CB, cerebellum; SC, spinal cord. Arrows indicate the degraded products of nonphosphorylated NF-200. GAPDH is the loading control. I, J, Activation of microglia in moca−/− mice. The activation of microglia is present in the spinal cord of moca−/− (J) but not in control (I) mice at the age of 20 months. Scale bar, 50 μm.
Figure 4.
Figure 4.
A–D, Autophagic vacuoles are present in spinal cord dystrophic axons of 20-month-old moca−/− mice. A, A general view of the wild-type spinal cord showing the normal appearance of myelinated and nonmyelinated axons. B, A closer look at the axonal cytoskeleton and organization showing microtubules (m, arrow) are often in bundles and more irregularly spaced compared with evenly distributed NFs (f, arrow). Mt (blue), Mitochondria. C, A typical axonal swelling showing accumulation of AVs (dashed circle) and a degenerated axon (arrowhead) in the spinal cord of moca−/− mice. D, Accumulation of AVs. Mt (blue), Mitochondria; 1 (orange), double-membrane autophagosomes representing early stages of autophagy; 2 (blue), residual bodies containing degraded organelles, representing late stages of autophagy; L (pink), lysosomes, before fusion with autophagosomes; Ml (yellow), multilaminar body. Scale bars: 2 μm (A, C) or 500 nm (B, D). E–J, Various pathological morphologies of axonal swellings in the spinal cord of 20-month-old moca−/− mice. E, Disorganized axoplasm. F, Disorganized axonal cytoskeletal components are tangled together, and mitochondria are buried in these abnormal structures. The organelles and AVs accumulate at the edge of the tangled axonal cytoskeleton (arrows). G, Hypertrophy of NFs is shown in the central part of axonal swellings with AVs and organelles accumulated at the edge (arrows). H, Various axoplasmic abnormalities are present in the axonal swelling including a hypertrophic cytoskeleton, organelles, and AVs (arrows). I, An axonal swelling has many vacuoles (V) along with accumulated organelles and AVs (arrows). J, An axonal swelling showing hypertrophic NFs (*f), and diffused organelles and AVs (arrows).
Figure 5.
Figure 5.
Accumulation of polyubiquitinated proteins in the spinal cord of 12-month-old moca−/− mice. A, Western blotting patterns of ubiquitinated proteins from different brain regions of control (+/+) and moca−/− (−/−) mice. CTX, cerebral cortex; SC, spinal cord. Arrowhead indicates monomer ubiquitins. Polyubiquitin-conjugated high molecular weight proteins are indicated by the bracket. B, A representation of Triton X-100-soluble and -insoluble fractions of protein extracts followed by immunoblotting with ubiquitin antisera. C, The data are quantified from six independent experiments. GAPDH is the loading control. The percentage change in the expression of polyubiquitin-conjugated high molecular weight proteins (bracket) in the Triton X-100-insuluble fraction was normalized to GAPDH and shown as the mean ± SD. Statistical analysis was done by a Student's t test (n = 6, *p < 0.05). D–G, Ubiquitin staining of the posterior funicular gray area of the spinal cord at the age of 2 months (D, E) and at the age of 20 months (F, G). Abnormal axonal spheroids stained by ubiquitin are present in moca−/− mice at the age of 20 months (G) but not at the age of 2 months (E). D, F, the age-matched controls. Scale bar, 50 μm. Ub, ubiquitin-containing aggregates.
Figure 6.
Figure 6.
A–H, Impaired axonal transport in moca−/− mice. Longitudinal views of fluorogold labeling in the lumbar 5 region of spinal cord of control (A) and moca−/− (B) mice at the age of 12 months. C, D, ChAT staining of the cross-sections of spinal cord of control (C) and moca−/− (D) mice. The percentage change of fluorogold labeling was quantified and represented in E. The fluorogold-labeled cells for each mouse group are shown as the mean ± SD. Statistical analysis was done by a Student's t test (n = 6, **p < 0.01). F, G, Schematic presentation of sciatic nerve ligation (F) and the APP expression levels of different parts in the axon (G). The ligation sites are indicated by arrows. The proximal (P part) and distal (D part) segments (on the cell body end) relative to the ligation sites, and the remaining distal site (toward the cell body end; E part) were collected for Western blot analysis after the surgery. The levels of APP in each axonal part were analyzed by using 22C11 antibody. H, The percentage of APP expression in the proximal (P part) and distal (D part) segments relative to the controls of similar segments of wild-type animals was quantified by NIH Image tools and the statistics were performed by a Student's t test. The data are presented as mean ± SD (n = 6, **p < 0.01). Scale bar, 50 μm.
Figure 7.
Figure 7.
Alterations in actin dynamics are mediated by cofilin in moca−/− mice. A, A representative spinal cord subcellular fractionation using a 0–30% continuous iodixanol gradient (n = 3). Each fraction is presented as the percentage of total protein (sum of OD in scanned blot) for each protein. B, Western blotting patterns of cofilin, phosphorylated cofilin, LIMK1, phosphorylated LIMK, PAK1/2/3, and phosphorylated PAK from the cerebral cortex and spinal cord of control (+/+) and moca−/− (−/−) mice. GAPDH was used as a loading control. The percentage change in the expression level for each protein is normalized to GAPDH and shown as the mean ± SD. Statistical analysis was done by a Student's t test (n = 6, **p < 0.01). CTX, cerebral cortex; SC, spinal cord. C1–C6, Immunostaining of cultured cortical neurons with the antibodies recognizing cofilin (green) and NF-200 (red), and merged (overlap yellow). The formation of rod-like structures (arrows) stained by the cofilin antibody is present in cultured moca−/− (−/−) neurons (C4, C6). The rod-like structures are largely confined to the thinner neurites, as previously shown (Minamide et al., 2000). Scale bar, 15 μm.
Figure 8.
Figure 8.
A model for the progression of axonal degeneration in moca−/− mice. See Discussion for details.

References

    1. Arber S, Barbayannis FA, Hanser H, Schneider C, Stanyon CA, Bernard O, Caroni P. Regulation of actin dynamics through phosphorylation of cofilin by LIM-kinase. Nature. 1998;393:805–809. - PubMed
    1. Bray JJ, Fernyhough P, Bamburg JR, Bray D. Actin depolymerizing factor is a component of slow axonal transport. J Neurochem. 1992;58:2081–2087. - PubMed
    1. Brown DA, Sawchenko PE. Time course and distribution of inflammatory and neurodegenerative events suggest structural bases for the pathogenesis of experimental autoimmune encephalomyelitis. J Comp Neurol. 2007;502:236–260. - PubMed
    1. Cai D, Leem JY, Greenfield JP, Wang P, Kim BS, Wang R, Lopes KO, Kim SH, Zheng H, Greengard P, Sisodia SS, Thinakaran G, Xu H. Presenilin-1 regulates intracellular trafficking and cell surface delivery of β-amyloid precursor protein. J Biol Chem. 2003;278:3446–3454. - PubMed
    1. Chen Q, Yoshida H, Schubert D, Maher P, Mallory M, Masliah E. Presenilin binding protein is associated with neurofibrillary alterations in Alzheimer's disease and stimulates tau phosphorylation. Am J Pathol. 2001;159:1597–1602. - PMC - PubMed

Publication types

MeSH terms