. 2008 Dec 12:1:2.
doi: 10.3389/neuro.16.002.2008. eCollection 2008.

Micropit: A New Cell Culturing Approach for Characterization of Solitary Astrocytes and Small Networks of these Glial Cells

Affiliations

Micropit: A New Cell Culturing Approach for Characterization of Solitary Astrocytes and Small Networks of these Glial Cells

William Lee et al. Front Neuroeng. .

Abstract

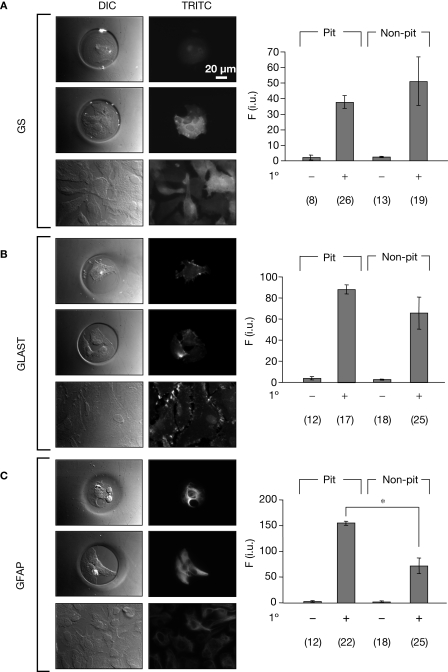
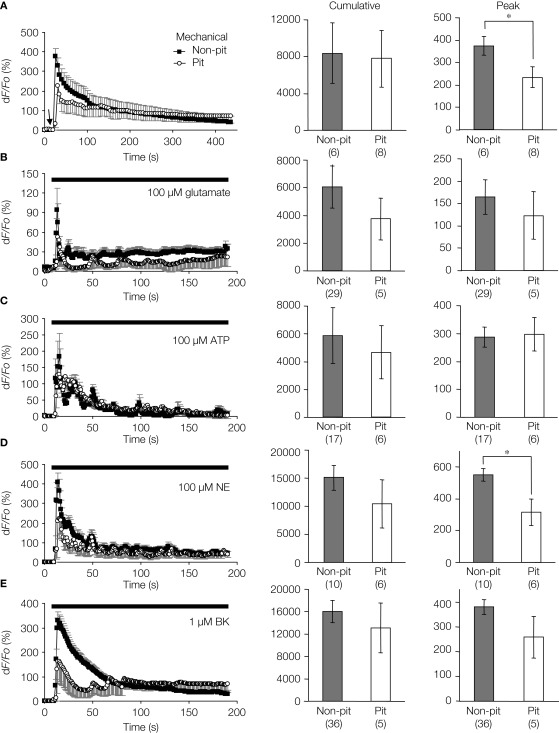
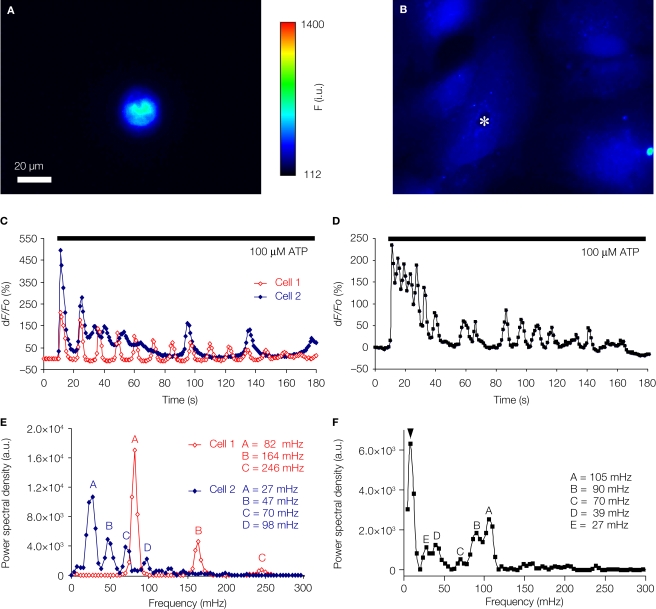
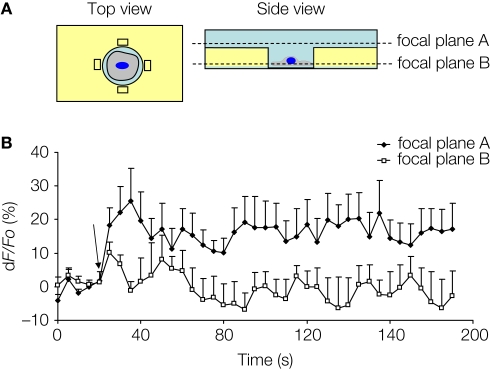
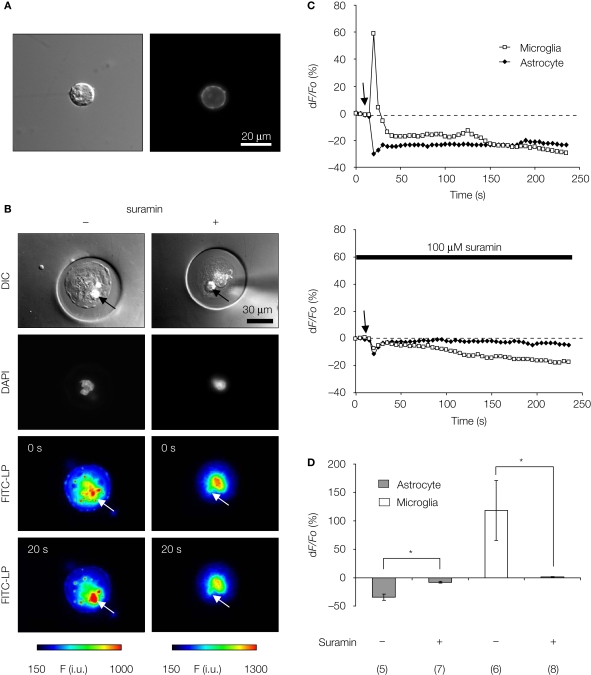
Astrocytes play an important role in cell-cell signaling in the mammalian central nervous system. The ability of astrocytes to communicate with surrounding cells through gap-junctional coupling or signaling via the release of transmitters makes characterization of these cells difficult in vitro and even more so in vivo. To simplify the complexity of common in vitro systems, introduced by intercellular communication between astrocytes, we developed a novel cell culturing method, in which purified rat visual cortical astrocytes were grown in spatially defined cell-adhesion wells which we termed micropits. We showed that astrocytes cultured in micropit regions were viable and exhibited similar characteristics of Ca(2+) dynamics and astrocytic marker expression to those of cells cultured in non-micropit regions. Examination of intracellular Ca(2+) oscillations in solitary astrocytes cultured in micropits revealed less variable oscillations than those of non-micropit grouped astrocytes, which were in contact with their neighbors. Solitary cells in micropit regions can undergo ATP-mediated astrocyte-microglia signaling, demonstrating that this culturing method can also be used to investigate glial-glial interactions in a spatially well-defined microenvironment.

Keywords: Ca2+ oscillations; astrocytes; glial–glial interactions; glutamate release; microglia.


Figures

Figure 1
Figure 1
PDMS mold design. (A) A Computer-Aided Design (CAD) image of the PDMS mold. (B) The cross-section [A–A line in (A)] of the designed PDMS mold with its specifications. (C) 3-D CAD image of the PDMS mold design. The mold was cut and cross-sectional images were taken at the positions indicated by the boxed regions along the dashed red line and the corresponding bright field images are shown in (E–G). (D) A top view image of the PDMS mold. (E) The height of the outer rim is 200 μm. (F) The pins are 75 μm in diameter and with a height of 50 μm consistent with designed specification. (G) The inter-pin distance from center to center is 300 μm. Scale bar in (E) applies to panels (E–G).
Figure 2
Figure 2
Micropatterned coverslip preparation scheme. (A) A polyethyleneimine (PEI)-coated coverslip was placed on top the PDMS mold with the PEI-coated side facing the PDMS mold as shown in (B). (C) Boiling agarose (2% w/v in water) was added to one of the open ends while gentle suction was applied at the other end to draw agarose into the channel until it was completely filled. The agarose was allowed to cool down and then the micropatterned coverslip was removed from the PDMS mold. (D) The micropatterned coverslip consists of a micropit array in the middle portion with non-pit segmental regions on each side. Plating and culturing astrocytes on these micropatterned coverslips yields cells grown in the micropit regions as shown in the schematic diagram in (E) as well as grouped cells in the two non-micropit regions on either side.
Figure 3
Figure 3
Characterization of micropits. Panels (A) and (B) are atomic force microscopy (AFM) images of a micropit in deflection mode and height mode, respectively. (B) The line shown in the height mode AFM image corresponds to the scanning direction of the AFM tip across the sample and the red cursors correspond to those in (D). (C) A topographic representation of the micropit. (D) The section analysis of the micropit shows the micropit with a diameter of 79 μm and a vertical distance of 998 nm. The vertical distance of the micropit measured with AFM is smaller than 50 μm since the 2% (w/v) agarose sample is dehydrated for use in the AFM. (E) The PEI-coated cell-adhesion surface of the micropit labeled with FITC-conjugated heparin as shown in DIC image (left panel) and epifluorescence image visualized with a FITC filter set (right panel). The strong labeling of PEI-coated surface with FITC-conjugated heparin shows that heparin can bind to the cell-adhesion surface of the micropit but not in regions of the coverslip covered by agarose. There is a radial gradient of heparin binding evident near the edge of the micropit indicated by two arrows where there is a decay in fluorescence intensity until it reaches the background level near the border of the micropit.
Figure 4
Figure 4
Cell cultures on micropatterned coverslips. (A) A DIC image of a live solitary astrocyte in a micropit. This cell has a polygonal morphology and it covers the majority of the cell adhesive surface. (B) A confocal image of a live solitary astrocyte that had transported the fluorescently labeled dipeptide β-Ala-Lys-AMCA into the cell resulting in a diffuse blue labeling of the cytoplasm. Rhodamine-containing agarose was used to visualize the boundaries of the micropit. The non-conjugated rhodamine which had diffused out of the agarose was endocytosed by the astrocyte causing red punctate labeling within the cytoplasm of the cell. (C–G) Viability of cultured astrocytes. Panels (E) and (G) show the viability of cells cultured on micropatterned coverslips examined using the vital dye calcein. (E) An image of calcein dye loading and retention in a solitary micropit cell and in grouped non-micropit cells. The corresponding bright field image (C) and epifluorescence image of nuclei labeling with Hoechst 33342 (D) are shown. Small networks of cells were found in micropits as shown in (F) where more than one nucleus present in the micropits was shown by Hoechst 33342 labeling; the corresponding image of calcein-loaded cells is shown in (G). (H) A frequency histogram of the number of astrocytes occupying each micropit (n = 210) as revealed by the nucleus/cell number. Scale bar in (C) applies to panels (D–E), while scale bar in (F) applies to (G).
Figure 5
Figure 5
Astrocytes in micropits express astrocytic markers. Astrocytes were labeled using primary antibodies against glutamine synthetase (GS), plasma membrane glutamate aspartate transporter (GLAST), or glial fibrillay acidic protein (GFAP) followed by TRITC-conjugated secondary antibodies (A–C). The images in each panel show fluorescence of solitary cells in micropits (top), small networks of cells in micropits (middle), and grouped non-micropit cells (bottom) with the corresponding differential interference contrast (DIC) images shown on the left. The bar graphs on the right of each panel show the quantification of fluorescence intensity (F) in intensity units (i.u.) within the camera's dynamic range (0–4095) shown as mean ± SEM; 1° indicates the presence (+) or absence (−) of primary antibody against the astrocytic marker. The numbers of cells tested are shown in parentheses. The GFAP labeling was significantly higher in micropit astrocytes compared to non-micropit astrocytes (Student's t-test; *p < 0.05).
Figure 6
Figure 6
Intracellular Ca2+ dynamics of astrocytes on micropatterned coverslips. (A–E) Comparison between the intracellular Ca2+ dynamics of solitary astrocytes in micropits and single astrocytes grown within grouped astrocytes in non-micropit regions after mechanical or agonist stimulation. The graphs on the left side represent fluo-3 fluorescence changes expressed as dF/Fo (%), with the points and error bars representing the mean and SEM (shown only in one direction for clarity). The arrow in panel (A) denotes the time that mechanical stimulation was applied to the cell. Horizontal bars in graphs (B–E) indicate the application of agonists: ATP, adenosine 5'-triphosphate; NE, norepinephrine; BK, bradykinin. Two sets of bar graphs on the right show quantification of cumulative and peak intracellular Ca2+ responses in astrocytes grown in micropit and non-pit regions of coverslips. The numbers of cells tested are shown in parentheses. The peak Ca2+ responses in non-micropit cells were significantly higher (Student's t-test; *p < 0.05) than in solitary micropit cells, upon mechanical (A) or NE stimulation (C).
Figure 7
Figure 7
Solitary micropit astrocytes exhibit agonist-evoked [Ca2+]i oscillations. (A) A solitary micropit astrocyte and (B) grouped non-micropit astrocytes loaded with the Ca2+ indicator fluo-3. The pseudo color scale represents the fluorescence intensity (F) ranging 112–1400 intensity units (i.u.). The time-lapse sequence of the intracellular Ca2+ response of a solitary micropit astrocyte in (A) stimulated with ATP is shown in (C, Cell 1) and also in Supplementary Movie 1, while the time-lapse sequence or a single astrocyte [marked with asterisk in (B)] within group of astrocytes grown in non-micropit region is shown in (D) and also in Supplementary Movie 2. (C) Two examples of the intracellular Ca2+ response of a solitary micropit astrocyte stimulated with ATP. The [Ca2+]i oscillations from Cell 1 (red trace) shows regular inter-peak intervals and a dampening in amplitude. The [Ca2+]i oscillations from Cell 2 (blue trace) showed dampening in peak amplitude as seen in Cell 1 and in addition it showed an increase in inter-peak intervals. (D) An example of ATP-evoked [Ca2+]i response of a single cell within the group of astrocytes in the non-micropit region. The intracellular Ca2+ response displays an oscillatory pattern with various inter-peak intervals. The power spectra in (E) and (F) show the frequency components of the oscillations corresponding to the Ca2+ signals in (C) and (D), respectively. (E) The power spectrum of Cell 1 shows only one dominant frequency of 82 mHz (peak A). Peaks B and C are 2nd and 3rd harmonics because their frequencies are multiple integers of the fundamental frequency. The power spectrum of Cell 2 shows a dominant frequency (peak A) at 27 mHz and subsequent peaks with decaying amplitude. (D) The power spectrum of the non-micropit astrocyte within the group of astrocytes was more complex with multiple peaks of various frequencies ranging from 27–105 mHz. The power spectrum density is given in arbitrary units (a.u.). Arrowhead in (F) indicates a peak that is below the cut-off frequency.
Figure 8
Figure 8
Solitary micropit astrocytes can release glutamate upon mechanical stimulation. (A) Schematic diagram of the experimental setup in top and side views. The regions of interest (ROIs; rectangles) we selected for this analysis were placed close to the edge of the micropit (top view). The side view showing the imaging planes (A and B) selected during GDH imaging experiments. (B) The time lapse of changes in NADH fluorescence expressed as dF/Fo (%). Each point on the graph represents the mean and SEM (shown only in one direction for clarity). The arrow denotes the time of mechanical stimulation. Upon stimulation, there was an increase in NADH fluorescence, reporting on extracellular glutamate, detected in the ROIs (extracellular space with external solution) when time lapse images were obtained in focal plane A (n = 5 cells) above the agarose. In parallel experiments, we detected glutamate release, albeit with reduced levels, in the ROIs when time lapse images were obtained in focal plane B (n = 5 cells) within the agarose. This reduced detection of glutamate release was most likely due to the restricted accessibility of agarose to GDH.
Figure 9
Figure 9
ATP-mediated astroglial-microglial signaling. (A) The purity of isolated microglia was confirmed with live-labeling of microglia with FITC-conjugated isolectin B4 as shown with the DIC image (left panel) and the epifluorescence image (right panel). (B) The nuclear staining with Hoechst 33342 (DAPI filter set) shows the presence of solitary astrocytes in each micropit, while the DIC images show the presence of one microglial cell (arrows) on top of the astrocyte in the micropit in each experiment. The pseudocolor images [linear representation of fluorescence intensity (F) ranging 150–1000 and 150–1300 intensity units (i.u.)] in the two lower panels were acquired with a FITC-long pass (FITC-LP) filter to examine the Ca2+ dynamics of astrocytes and microglia that were loaded with the Ca2+ indicator Fura Red and fluo-3, respectively. The arrows indicate the location of the microglial cells. In the experiment shown on the left image series that was performed in the absence of suramin, mechanical stimulation of the solitary micropit astrocyte caused a transient decrease in Fura Red fluorescence, while the microglial cell showed a transient increase in fluo-3 fluorescence; both intensity changes report on the increase in intracellular Ca2+ levels. These responses were reduced when cells were pre-incubated with suramin for 5 min, which was then kept throughout the entire experiment, to block purinergic receptors [right image series of panel (B)]. The right DIC image contains a shadow of the micropipette used for induction of mechanical stimulus. (C) Time lapse changes in fluorescence expressed as dF/Fo (%) corresponding to the experiments in (B). (D) Quantification of the peak Ca2+ responses of astrocytes and microglia in each experimental group with (+) or without (−) suramin. The numbers of cells tested are shown in parentheses. Bars represent means ± SEMs. Asterisks indicate statistical significance (Student's t-test; p < 0.05).
Figure 10
Figure 10
Diffusion model of point source glutamate release from a micropit. (A) Bright field image of micropit regions of the micropatterned coverslip. The shortest inter-pit distance (center to center) is 300 μm, while the diagonal distance to the nearest micropit is 424 μm. (B) Concentration profile of point source diffusion of glutamate (initial concentration of 100 μM glutamate) from a micropit. (C) The concentration profile of glutamate at various distances and times from the source.
Figure 11
Figure 11
Examination of intercellular communication pathways between astrocytes in neighboring micropits. (A) Simultaneous monitoring of [Ca2+]i in astrocytes loaded with fluo-3 in two adjacent micropits. The top panel in (A) shows a solitary astrocyte in a micropit with four cells in a neighboring pit with nuclei stained with Hoechst 33342, while the lower panel shows the same cells loaded with fluo-3 in pseudocolor prior to stimulation (0 s). Mechanical stimulation of a solitary astrocyte in a micropit (leftmost cell) elicited an increase in [Ca2+]i in the cells in the nearest (right hand) micropit (85 s). After recovery, the cells in the right hand pit were stimulated (arrow) with glutamate (100 μM); the peak response is shown in far right image. (B) A representative experiment where mechanical stimulation (85 s) of the solitary astrocyte in the micropit (left) did not elicit any Ca2+ response in the cells in the adjacent micropit (right), even though these cells responded to subsequent stimulation with glutamate (arrow). Dotted circles in (A,B) indicate astrocytes within neighboring micropits that were used for time-lapse traces (C,D). The pseudo color scale represents the fluorescence intensity (F) ranging 117–700 and 116–400 intensity units (i.u.). All images represent raw data with pixel intensities within the camera's dynamic range (0–4095). (C,D) Time lapse series of fluo-3 fluorescence of individual cells, corresponding to the experiments shown in (A,B) reporting on [Ca2+]i dynamics. The arrows (left panels) indicates when mechanical stimulation was applied, the bars (right panels) denote when control glutamate stimulation was applied. The numbers in parentheses indicate the number of cases in each condition.

References

    1. Aizman O., Uhlen P., Lal M., Brismar H., Aperia A. (2001). Ouabain, a steroid hormone that signals with slow calcium oscillations. Proc. Natl. Acad. Sci. U.S.A. 98, 13420–1342410.1073/pnas.221315298 - DOI - PMC - PubMed
    1. Araque A., Parpura V., Sanzgiri R. P., Haydon P. G. (1999). Tripartite synapses: glia, the unacknowledged partner. Trends Neurosci. 22, 208–21510.1016/S0166-2236(98)01349-6 - DOI - PubMed
    1. Bekkers J. M., Stevens C. F. (1991). Excitatory and inhibitory autaptic currents in isolated hippocampal neurons maintained in cell culture. Proc. Natl. Acad. Sci. U.S.A. 88, 7834–783810.1073/pnas.88.17.7834 - DOI - PMC - PubMed
    1. Bolsover S., Silver R. A. (1991). Artifacts in calcium measurement: recognition and remedies. Trends Cell Biol. 1, 71–7410.1016/0962-8924(91)90093-O - DOI - PubMed
    1. Charles A. C., Dirksen E. R., Merrill J. E., Sanderson M. J. (1993). Mechanisms of intercellular calcium signaling in glial cells studied with dantrolene and thapsigargin. Glia 7, 134–14510.1002/glia.440070203 - DOI - PubMed