

Brain temperature and pH measured by (1)H chemical shift imaging of a thulium agent
- PMID: 19130468
- PMCID: PMC2735415
- DOI: 10.1002/nbm.1312
Brain temperature and pH measured by (1)H chemical shift imaging of a thulium agent
Abstract
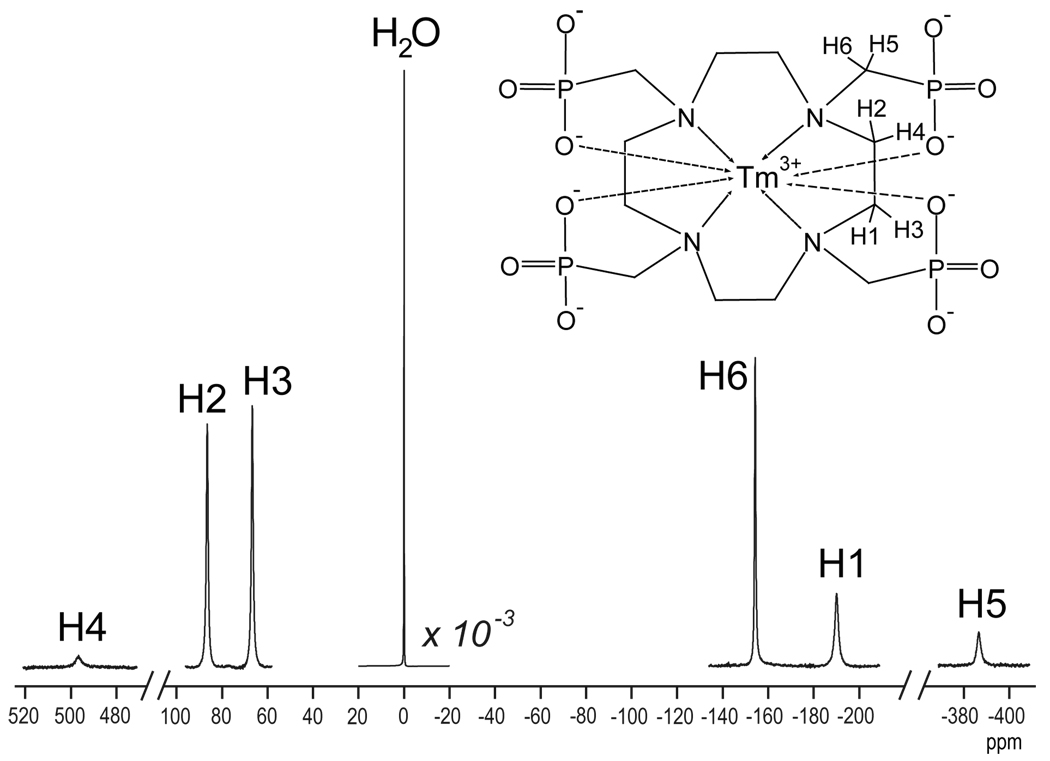
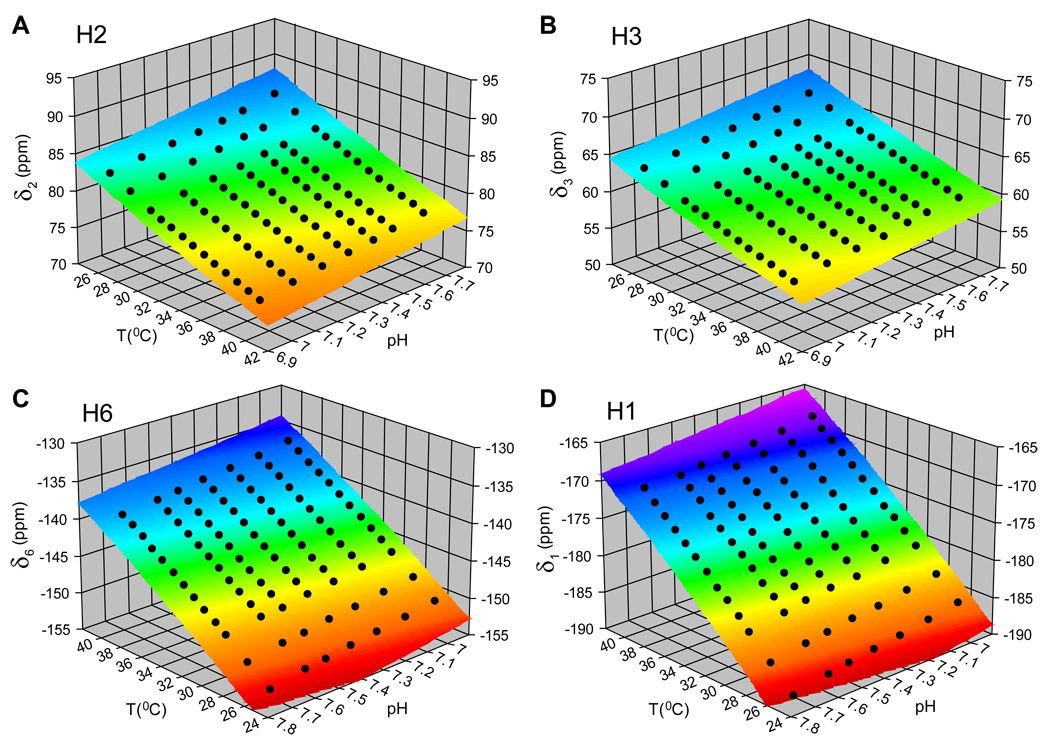
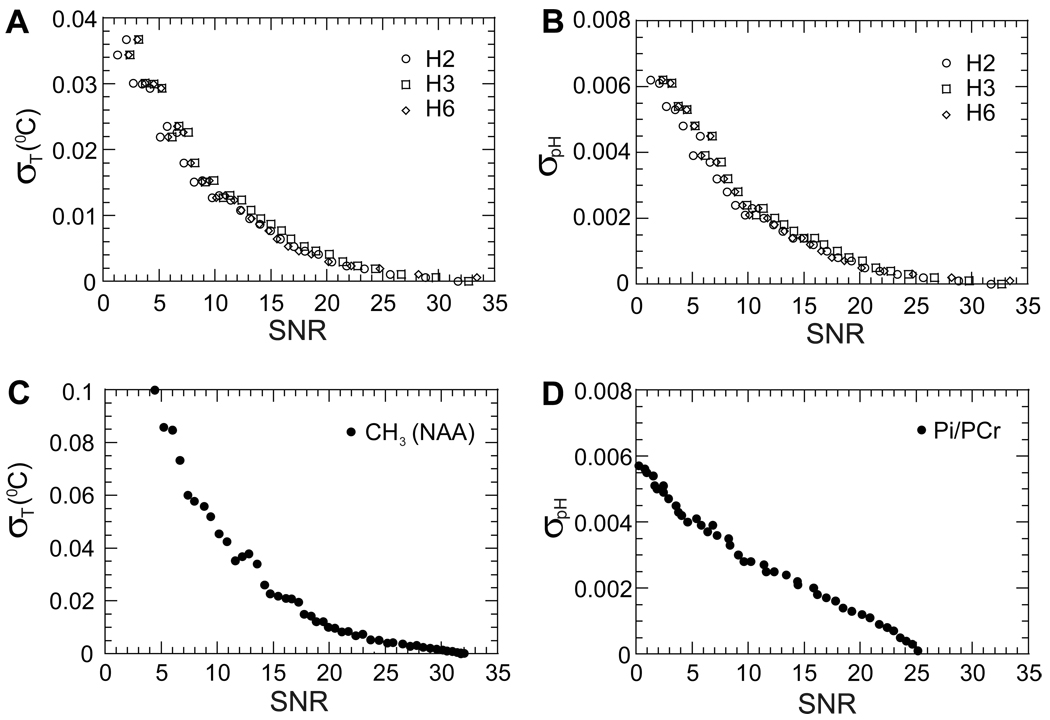
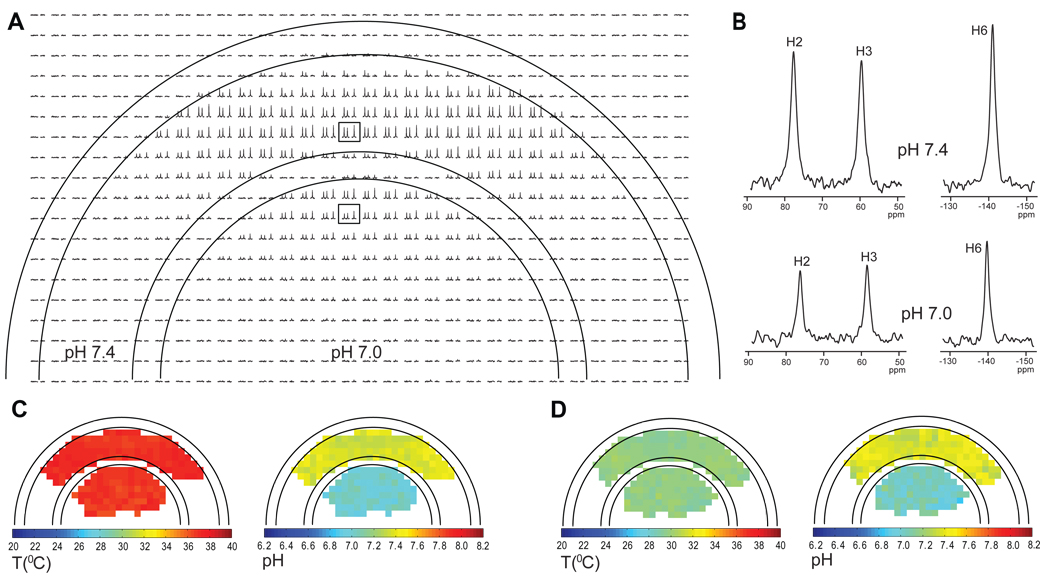
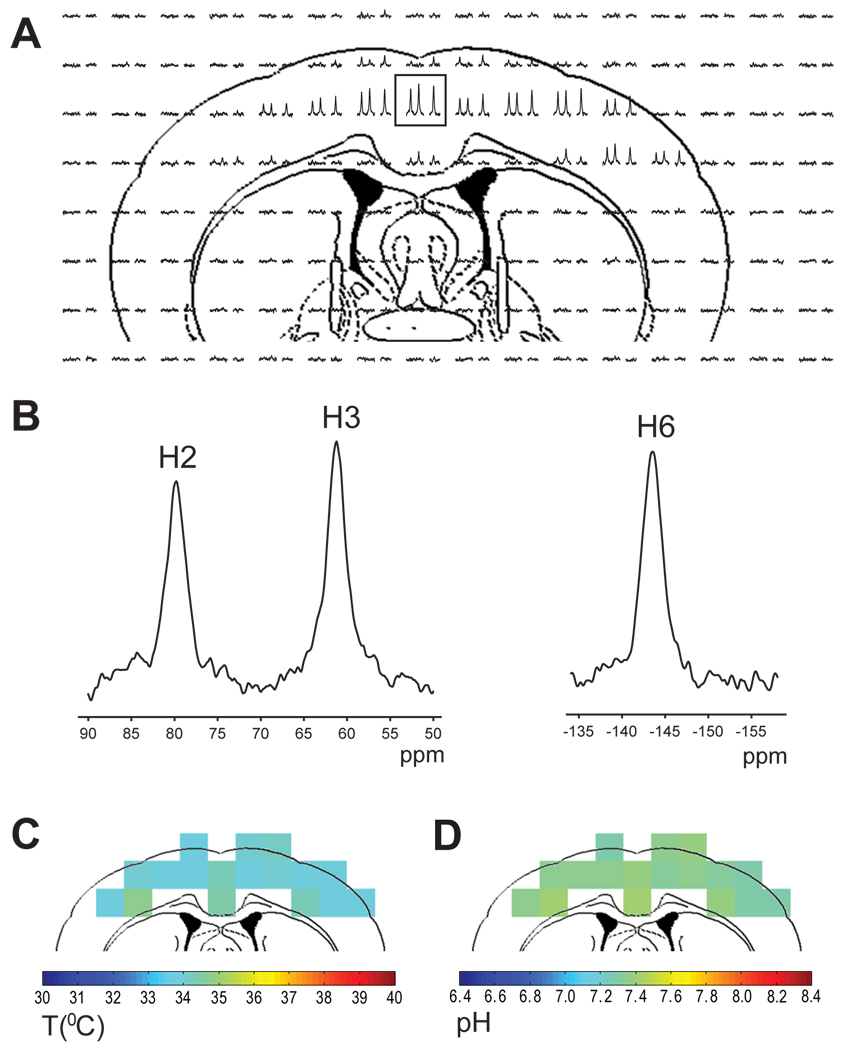
Temperature and pH are two of the most important physiological parameters and are believed to be tightly regulated because they are intricately related to energy metabolism in living organisms. Temperature and/or pH data in mammalian brain are scarce, however, mainly because of lack of precise and non-invasive methods. At 11.7 T, we demonstrate that a thulium-based macrocyclic complex infused through the bloodstream can be used to obtain temperature and pH maps of rat brain in vivo by (1)H chemical shift imaging (CSI) of the sensor itself in conjunction with a multi-parametric model that depends on several proton resonances of the sensor. Accuracies of temperature and pH determination with the thulium sensor - which has a predominantly extracellular presence - depend on stable signals during the course of the CSI experiment as well as redundancy for temperature and pH sensitivities contained within the observed signals. The thulium-based method compared well with other methods for temperature ((1)H MRS of N-acetylaspartate and water; copper-constantan thermocouple wire) and pH ((31)P MRS of inorganic phosphate and phosphocreatine) assessment, as established by in vitro and in vivo studies. In vitro studies in phantoms with two compartments of different pH value observed under different ambient temperature conditions generated precise temperature and pH distribution maps. In vivo studies in alpha-chloralose-anesthetized and renal-ligated rats revealed temperature (33-34 degrees C) and pH (7.3-7.4) distributions in the cerebral cortex that are in agreement with observations by other methods. These results show that the thulium sensor can be used to measure temperature and pH distributions in rat brain in vivo simultaneously and accurately using Biosensor Imaging of Redundant Deviation in Shifts (BIRDS).
Copyright (c) 2008 John Wiley & Sons, Ltd.
Figures
Similar articles
-
Brain temperature by Biosensor Imaging of Redundant Deviation in Shifts (BIRDS): comparison between TmDOTP5- and TmDOTMA-.NMR Biomed. 2010 Apr;23(3):277-85. doi: 10.1002/nbm.1461. NMR Biomed. 2010. PMID: 19957287 Free PMC article.
-
Brain temperature measured by 1H-NMR in conjunction with a lanthanide complex.J Appl Physiol (1985). 2003 Apr;94(4):1641-9. doi: 10.1152/japplphysiol.00841.2002. Epub 2002 Nov 27. J Appl Physiol (1985). 2003. PMID: 12626478
-
In vivo three-dimensional molecular imaging with Biosensor Imaging of Redundant Deviation in Shifts (BIRDS) at high spatiotemporal resolution.NMR Biomed. 2013 Nov;26(11):1589-95. doi: 10.1002/nbm.2995. Epub 2013 Jul 24. NMR Biomed. 2013. PMID: 23881869 Free PMC article.
-
Non-invasive MR thermography using the water proton chemical shift.Int J Hyperthermia. 2005 Sep;21(6):547-60. doi: 10.1080/02656730500204495. Int J Hyperthermia. 2005. PMID: 16147439 Review.
-
Hyperpolarized 13C-labeled bicarbonate (H13CO3-) for in vivo pH measurement with 13C magnetic resonance spectroscopy.2010 Jan 25 [updated 2010 Apr 12]. In: Molecular Imaging and Contrast Agent Database (MICAD) [Internet]. Bethesda (MD): National Center for Biotechnology Information (US); 2004–2013. 2010 Jan 25 [updated 2010 Apr 12]. In: Molecular Imaging and Contrast Agent Database (MICAD) [Internet]. Bethesda (MD): National Center for Biotechnology Information (US); 2004–2013. PMID: 20641986 Free Books & Documents. Review.
Cited by
-
Lanthanide ion (III) complexes of 1,4,7,10-tetraazacyclododecane-1,4,7,10-tetraaminophosphonate for dual biosensing of pH with chemical exchange saturation transfer (CEST) and biosensor imaging of redundant deviation in shifts (BIRDS).Contrast Media Mol Imaging. 2015 Jan-Feb;10(1):51-8. doi: 10.1002/cmmi.1604. Epub 2014 May 6. Contrast Media Mol Imaging. 2015. PMID: 24801742 Free PMC article.
-
Design and Evaluation of a Lactate Microbiosensor: Toward Multianalyte Monitoring of Neurometabolic Markers In Vivo in the Brain.Molecules. 2022 Jan 14;27(2):514. doi: 10.3390/molecules27020514. Molecules. 2022. PMID: 35056837 Free PMC article.
-
Towards Photoswitchable Contrast Agents for Absolute 3D Temperature MR Imaging.Angew Chem Int Ed Engl. 2021 Apr 6;60(15):8220-8226. doi: 10.1002/anie.202015851. Epub 2021 Mar 3. Angew Chem Int Ed Engl. 2021. PMID: 33606332 Free PMC article.
-
Transmembrane pH gradient imaging in rodent glioma models.NMR Biomed. 2024 May;37(5):e5102. doi: 10.1002/nbm.5102. Epub 2024 Jan 23. NMR Biomed. 2024. PMID: 38263680 Free PMC article.
-
Dynamic Thermal Mapping of Localized Therapeutic Hypothermia in the Brain.J Neurotrauma. 2020 Jan 1;37(1):55-65. doi: 10.1089/neu.2019.6485. Epub 2019 Aug 22. J Neurotrauma. 2020. PMID: 31311414 Free PMC article.
References
-
- Young CC, Sladen RN. Temperature monitoring. Int Anesthesiol Clin. 1996;34(3):149–174. - PubMed
-
- Brugge JF, Poon PW, So AT, Wu BM, Chan FH, Lam FK. Thermal images of somatic sensory cortex obtained through the skull of rat and gerbil. Exp Brain Res. 1995;106(1):7–18. - PubMed
-
- Denis de Senneville B, Quesson B, Moonen CT. Magnetic resonance temperature imaging. Int J Hyperthermia. 2005;21(6):515–531. - PubMed
-
- Gillies RJ, Raghunand N, Garcia-Martin ML, Gatenby RA. pH imaging. A review of pH measurement methods and applications in cancers. IEEE Eng Med Biol Mag. 2004;23(5):57–64. - PubMed
-
- De Poorter J, De Wagter C, De Deene Y, Thomsen C, Stahlberg F, Achten E. Noninvasive MRI thermometry with the proton resonance frequency (PRF) method: in vivo results in human muscle. Magn Reson Med. 1995;33(1):74–81. - PubMed
Publication types
MeSH terms
Substances
Grants and funding
LinkOut - more resources
Full Text Sources
