Review
. 2009 Feb;30(2):232-52.
doi: 10.3174/ajnr.A1461. Epub 2009 Jan 8.

Susceptibility-weighted imaging: technical aspects and clinical applications, part 2

Affiliations
Review

Susceptibility-weighted imaging: technical aspects and clinical applications, part 2

S Mittal et al. AJNR Am J Neuroradiol. 2009 Feb.

Abstract

Susceptibility-weighted imaging (SWI) has continued to develop into a powerful clinical tool to visualize venous structures and iron in the brain and to study diverse pathologic conditions. SWI offers a unique contrast, different from spin attenuation, T1, T2, and T2* (see Susceptibility-Weighted Imaging: Technical Aspects and Clinical Applications, Part 1). In this clinical review (Part 2), we present a variety of neurovascular and neurodegenerative disease applications for SWI, covering trauma, stroke, cerebral amyloid angiopathy, venous anomalies, multiple sclerosis, and tumors. We conclude that SWI often offers complementary information valuable in the diagnosis and potential treatment of patients with neurologic disorders.


Figures
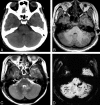
Fig 1.
Fig 1.
A 38-year-old woman who sustained severe TBI following a motor vehicle crash and lapsed into a coma. CT and MR images were obtained on the second day of hospitalization. A, Nonenhanced CT scan shows suspicious low attenuations in the pons and bilateral brachium pontis. B, T1-weighted image shows similar hypointense lesions in the pons, right brachium pontis, and right hemisphere of the cerebellum. C, T2-weighted image identifies multiple hyperintense lesions in the pons, bilateral brachium pontis, and right cerebellar hemisphere. D, SWI demonstrates multiple hypointense lesions in the left brachium pontis and both hemispheres of the cerebellum. There are more lesions shown on SWI, and they are also larger than those shown on CT and conventional MR imaging sequences. The shape of hemorrhagic lesions in the right cerebellar hemisphere reflects damage caused by shearing effect, indicating diffuse axonal injury. Courtesy of Dr Lei Jing, Tianjing Huanhu Hospital, Tianjing, China.
Fig 2.
Fig 2.
A, CT scan shows slightly higher attenuation (white arrow) in the posterior horn of right lateral ventricle. B, The SWI data clearly show hemorrhage (black arrows) inside both posterior horns of the lateral ventricle. Courtesy of Dr Lei Jing, Tianjing Huanhu Hospital, Tianjing, China.
Fig 3.
Fig 3.
A, CT scan shows high-attenuation signals within the sulci of the cerebrum (white arrows), indicating traumatic subarachnoid hemorrhage. B, SWI clearly shows hemorrhage within the sulci of the cerebrum (black arrows), in agreement with the results of CT, but with a sharper contrast. Courtesy of Dr Lei Jing, Tianjing Huanhu Hospital, Tianjing, China.
Fig 4.
Fig 4.
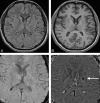
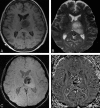
A patient who had sudden onset of aphasia and right paresthesias 5 years earlier and who partially recovered neurologic function after treatment of the acute stroke. A and B, Findings of follow-up MR images are almost normal on the FLAIR (A) and T1-weighted images (B). C and D, The original TE = 40 ms magnitude image (C) does not show any abnormality; however, the SWI phase image (D) shows a small hemorrhagic lesion (white arrow) in the genu of the internal capsule and internal globus pallidus.
Fig 5.
Fig 5.
Cardioembolic stroke in the left MCA, 2 hours after onset. A, MRA shows lack of time-of-flight signal intensity in the distal M1 segment of the left MCA. B, FLAIR image displays intra-arterial signal intensity (arrow) of the left MCA branches along the lateral sulcus, indicating acute occlusion. C, DWI shows a small hyperintense lesion within the territory of the left MCA. D, SWI reveals localized hyposignal (arrow) in the left M1 segment, representing the acute thromboembolus itself. E and F, SWI demonstrates prominently hypointense cortical veins within the left MCA territory, suggesting relatively increased deoxyhemoglobin in the draining veins within the acutely ischemic region. G and H, The MTT map shows delayed transit times in the left MCA territory, matching SWI well. I, The rCBF is moderately reduced. Courtesy of Dr Masahiro Ida, Ebara Hospital, Tokyo, Japan.
Fig 6.
Fig 6.
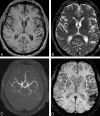
Multiple microbleeds in CAA. A and B, T1-weighted (A) and T2-weighted (B) images do not reveal significant abnormalities except for the lesion in the left temporoparietal area. C, MRA shows normal brain vascular structure. D, SWI demonstrates, in addition to hemorrhage in the left temporoparietal region, multiple microbleeds distributed along the gray/white matter interface in the whole brain, strongly suggesting CAA.
Fig 7.
Fig 7.
An acute stroke patient with severe stenosis of the left internal carotid artery. The apparent diffusion coefficient map (A) shows an acute infarction as a low signal intensity (white arrow) together with old infarctions (which appear bright). The SWI data (B) shows prominently hypointense cortical veins reflecting the reduced oxygenation levels in the left anterior cerebral artery territory (arrows). Courtesy of Jonathon Grynspan, McMaster University, Hamilton, Ontario, Canada.
Fig 8.
Fig 8.
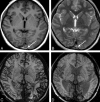
A, The SWI processed data for this 57-year-old patient with CADASIL shows 2 small bleeds in the anterior thalamus (arrows) and increased iron content in the basal ganglia. B, The SWI processed image for a healthy 53-year-old volunteer shows significant iron only in the globus pallidus. C and D, The T2 (C) and T1 (D) spin-echo images of the patient with CADASIL show diffuse white matter hyperintensities.
Fig 9.
Fig 9.
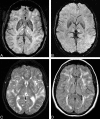
SWI data for 3 slices through the pons of a progressive MS patient with severe iron build up in various parts of the brain.
Fig 10.
Fig 10.
Different lesion distributions on SWI phase images and conventional MR images at 4T. A and B, Two lesions (long arrows) shown on the SWI phase image (A) are barely seen on FLAIR (B). C and D, On the other hand, lesions (short arrows) along the lateral ventricles shown on FLAIR (C) are not obvious on the SWI phase image (D).
Fig 11.
Fig 11.
In a patient with MS, iron builds up not only in the basal ganglia but also in the pulvinar nucleus of the thalamus. A, The SWI image for the patient shows the areas of increased iron content, including the pulvinar. B, In the healthy age-matched volunteer, there is little iron deposition in the pulvinar nucleus.
Fig 12.
Fig 12.
SWI data in a patient with progressive MS exquisitely demonstrate the location of iron deposition in the deep gray matter. The second scan (B) was acquired 1.5 years after the first scan (A) and shows an increase in the iron content in the globus pallidus as demonstrated by the increased phase values and aliasing seen in B.
Fig 13.
Fig 13.
Detailed visualization of the thalamic structures by using SWI filtered-phase images in a patient with MS.
Fig 14.
Fig 14.
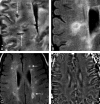
Another MS case shows a ringlike structure in the SWI filtered-phase image. The lesion of interest is highlighted by the either a white or black arrow. AD, The T2 (A), T1 (B), original magnitude (C), and SWI filtered-phase (D) images show different lesion contrast. Iron appears in a ring structure with a smaller amount of iron scattered inside the lesion.
Fig 15.
Fig 15.
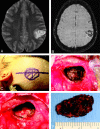
A 24-year-old Hispanic woman presenting with partial sensorimotor seizures. A, Axial T2-weighted FSE image shows a left parietal cavernous malformation. B, Because of its exquisite sensitivity in identifying venous structures and blood products, SWI provides a more complete evaluation of patients with CCM. CF, Intraoperative photographs show circumferential dissection and complete resection of the left parietal cavernous malformation by using microsurgical techniques.
Fig 16.
Fig 16.
A 25-year-old man evaluated for long-term migraine problems. A, T2-weighted image shows a small vascular flow void (arrow) surrounded by an ill-defined region of mixed intensities in the left superior frontal gyrus. B, SWI depicts numerous fine well-delineated anomalous medullary veins that converge into a dilated transcortical collector vein. This forms the classic “caput medusa.” C, Postcontrast 3D T1-weighted image reveals the dilated medullary veins and an enlarged collector vein in excellent agreement with SWI.
Fig 17.
Fig 17.
SWS in a 5-year-old girl. A, The postcontrast T1-weighted image shows enhancement of the leptomeninges (white arrowhead) and periventricular veins (arrow). B, SWI shows extensive hypointensity along the gyri (arrowhead and dotted arrow) due to calcification of the gyri. The abnormal periventricular veins (arrow) shows better detail than the postcontrast T1-weighted image (A).
Fig 18.
Fig 18.
Cerebral venous sinus thrombosis. A and B, Precontrast T1-weighted (A) and T2-weighted (B) images show normal cerebral parenchyma except in the sagittal sinus (arrow), where a hyperintense (T1) and isointense (T2) thrombus is replacing the normal low signal intensity of flowing blood. C, SWI shows significant engorgement of the venous system of the whole brain because of venous hypertension secondary to CVST. D, Three months later (after thrombolytic therapy), SWI shows a return to a normal-appearing venous system. Courtesy of Dr Guangbin Wang, Shandong Medical Imaging Research Institute, Jinan, China.
Fig 19.
Fig 19.
Conventional GE magnitude images show both calcifications and hemorrhage as areas of hypointense signal intensity. A, This is equally true for the SWI magnitude image with a TE of 40 ms at 1.5T. B, Usually, a CT scan is used to identify calcium. Here, the CT scan reveals many small calcifications. The SWI filtered-phase image is a means to differentiate paramagnetic from diamagnetic substances because the former will have a negative phase and the latter a positive phase (for a right-handed system). C, The phase image associated with the magnitude image in A shows a 1-to-1 correspondence of the positive phase with the calcifications in the CT scan (B).
Fig 20.
Fig 20.
Left temporo-occipital high-grade glioma. SWI contrast-enhanced image (C) shows similar boundary information and considerably more detail of the internal architecture of the tumor compared with the T1-weighted precontrast (A) or postcontrast image (B).
Fig 21.
Fig 21.
Ill-defined right temporal tumor histologically proved to be a glioblastoma. Compared with contrast-enhanced T1 (A), precontrast T1 (B), and FSE T2 (D) images, SWI (C) and phase images (E and F) are more sensitive in outlining areas of hemorrhage as well as the venous structures and thus can be a useful adjunct in defining the tumor characteristics. The phase images are shown for left-handed (E) and right-handed systems (F).
Fig 22.
Fig 22.
AC, Left temporal glioblastoma. High-grade gliomas are well depicted on usual diagnostic sequences. DF, However, SWI and phase images provide valuable additional information on the internal vascular architecture and presence of microhemorrhages within the tumor; F, phase image for a left-handed system.
Fig 23.
Fig 23.
Left thalamic glioma. The size, location, and surrounding edema are well shown on the T1-weighted (A) and T2-weighted images (C). B, However, SWI delineates the interior structure and hemorrhages inside the tumors. D, The SWI phase image shows that the thalamostriate veins are compressed to the right by the tumor.
Fig 24.
Fig 24.
A meningioma located in the left posterior horn of the lateral ventricle. A, The tumor is diffusely enhanced in the postcontrast T1-weighted image. B, SWI delineates the veins around the tumor.
Fig 25.
Fig 25.
A tumor located in the posterior horn of the left lateral ventricle. A, Postcontrast T1-weighted image shows enhancement of the tumor periphery. B, Precontrast SWI shows a small hemorrhage inside the tumor (arrow). C, In postcontrast SWI, a new hypointense signal intensity appears after contrast agent injection, which indicates the presence of intratumoral vessels; the signal intensity from the hemorrhage inside the tumor remains unchanged (arrow).
Fig 26.
Fig 26.
An oligodendroglioma in the right frontoinsular region. A, CT scan shows patchy calcification inside the tumor. B, SWI magnitude image shows hypointense signal intensity inside the tumor but cannot identify whether the hypointensity is hemorrhage or calcification. C, On the SWI phase image, calcification is identified and matches the CT results well.
Fig 27.
Fig 27.
Bilateral periventricular metastases from renal cell carcinoma treated with gamma knife radiosurgery. SWI (A) effectively identifies areas of microhemorrhages consistent with radiation necrosis, compared with the contrast-enhanced T1-weighted image (B).

Comment in

References

    1. Haacke EM, Mittal S, Wu Z, et al. Susceptibility-weighted imaging: technical aspects and clinical applications, Part I AJNR Am J Neuroradiol.2009;30:19–30 - PMC - PubMed
    1. Tong KA, Ashwal S, Obenaus A, et al. Susceptibility-weighted MR imaging: a review of clinical applications in children. AJNR Am J Neuroradiol 2008;29:9–17 - PMC - PubMed
    1. Brown AW, Elovic EP, Kothari S, et al. Congenital and acquired brain injury. Part 1. Epidemiology, pathophysiology, prognostication, innovative treatments, and prevention. Arch Phys Med Rehabil 2008;89:S3–8 - PubMed
    1. Tong KA, Ashwal S, Holshouser BA, et al. Hemorrhagic shearing lesions in children and adolescents with posttraumatic diffuse axonal injury: improved detection and initial results. Radiology 2003;227:332–39 - PubMed
    1. Tong KA, Ashwal S, Holshouser BA, et al. Diffuse axonal injury in children: clinical correlation with hemorrhagic lesions. Ann Neurol 2004;56:36–50 - PubMed

Publication types

MeSH terms