. 2009 Apr;37(4):857-64.
doi: 10.1124/dmd.108.025023. Epub 2009 Jan 8.

Measurement of membrane-bound human heme oxygenase-1 activity using a chemically defined assay system

Affiliations

Measurement of membrane-bound human heme oxygenase-1 activity using a chemically defined assay system

Warren J Huber 3rd et al. Drug Metab Dispos. 2009 Apr.

Abstract

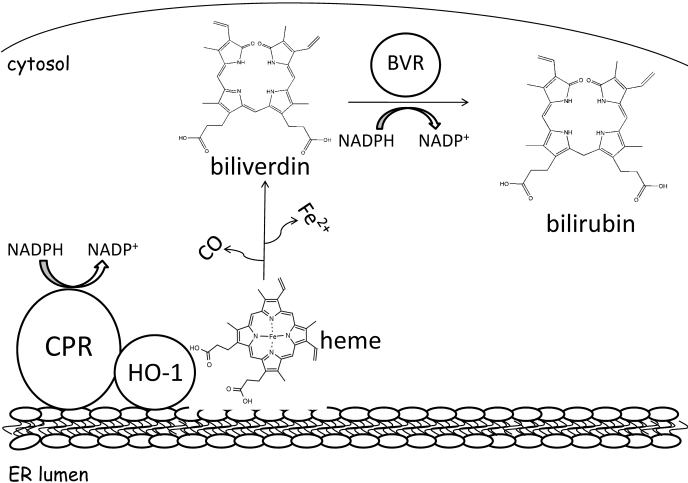
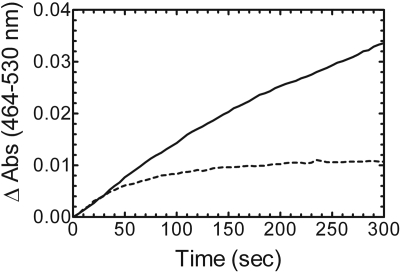
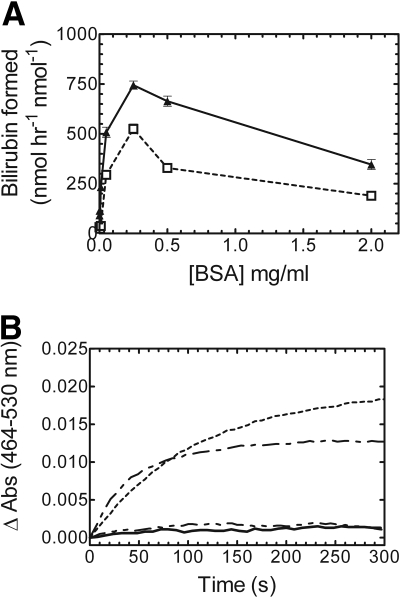
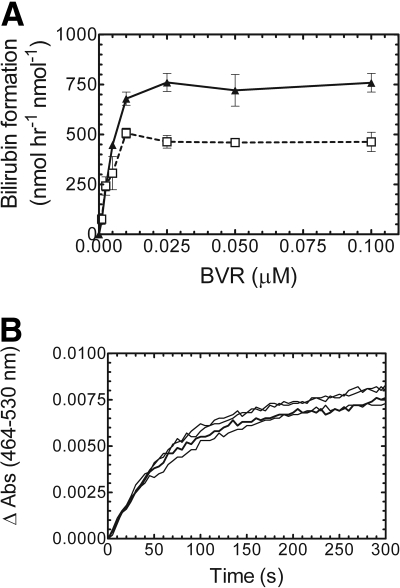
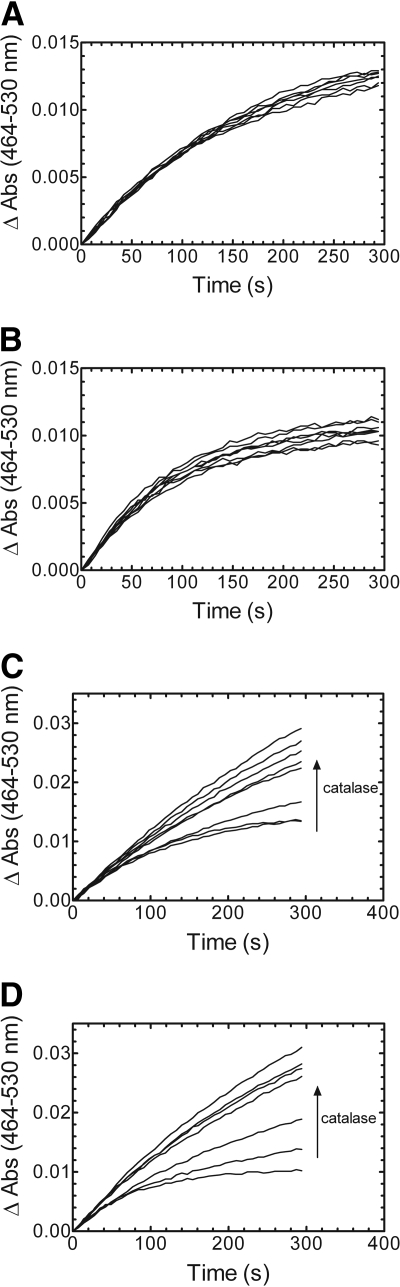
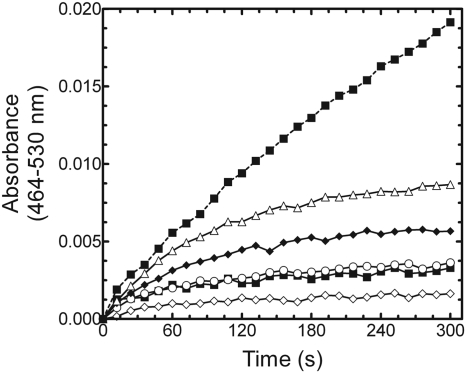
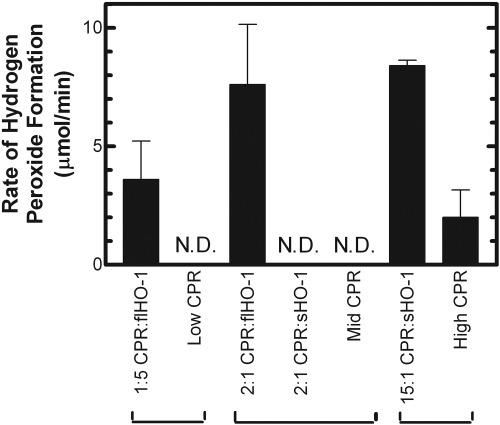
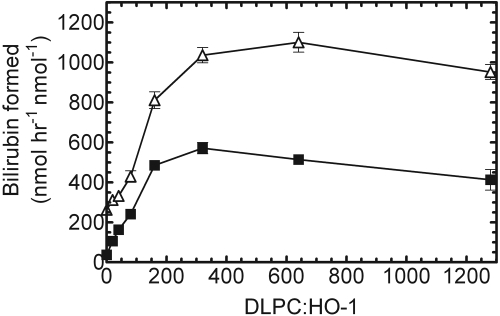
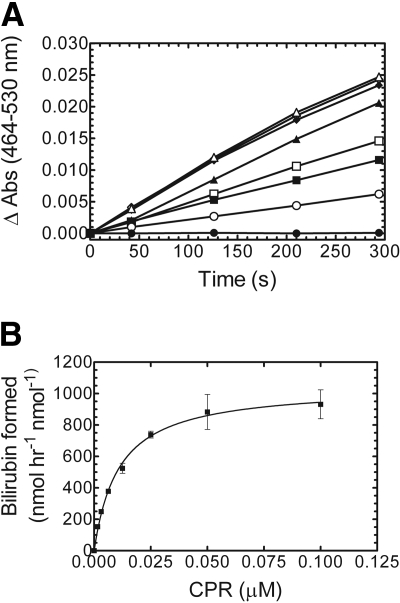
Heme oxygenase (HO) catalyzes heme degradation in a reaction requiring NADPH-cytochrome P450 reductase (CPR). Although most studies with HO used a soluble 30-kDa form, lacking the C-terminal membrane-binding region, recent reports show that the catalytic behavior of this enzyme is very different if this domain is retained; the overall activity was elevated 5-fold, and the K(m) for CPR decreased approximately 50-fold. The goal of these studies was to accurately measure HO activity using a coupled assay containing purified biliverdin reductase (BVR). This allows measurement of bilirubin formation after incorporation of full-length CPR and heme oxygenase-1 (HO-1) into a membrane environment. When rat liver cytosol was used as the source of partially purified BVR, the reaction remained linear for 2 to 3 min; however, the reaction was only linear for 10 to 30 s when an equivalent amount of purified, human BVR (hBVR) was used. This lack of linearity was not observed with soluble HO-1. Optimal formation of bilirubin was achieved with concentrations of bovine serum albumin (0.25 mg/ml) and hBVR (0.025-0.05 microM), but neither supplement increased the time that the reaction remained linear. Various concentrations of superoxide dismutase had no effect on the reaction; however, when catalase was included, the reactions were linear for at least 4 to 5 min, even at high CPR levels. These results not only show that HO-1-generated hydrogen peroxide leads to a decrease in HO-1 activity but also provide for a chemically defined system to be used to examine the function of full-length HO-1 in a membrane environment.


Figures

F<sc>ig</sc>. 1.
Fig. 1.
Heme degradation pathway. After an obligatory interaction with CPR, HO-1 initiates the oxidative degradation of heme to biliverdin, CO, and Fe2+. Biliverdin is further metabolized to the lipophilic product, bilirubin, by BVR. Although HO-1 and CPR exist bound to the endoplasmic reticulum membrane, BVR is present in the cytosol.
F<sc>ig</sc>. 2.
Fig. 2.
Bilirubin formation catalyzed by BVR from two different sources. Recombinant hBVR was purified to apparent homogeneity, and rat liver cytosol served as a partially purified source of BVR. Real-time curves from 0 to 300 s of bilirubin formation catalyzed by partially pure BVR (solid line) and pure BVR (dashed line).
F<sc>ig</sc>. 3.
Fig. 3.
BSA is required for optimal bilirubin production at subsaturating and saturating CPR levels. A, BSA titration of a bilirubin assay at 1:5 CPR/HO-1 (□, dashed line) and 2:1 CPR/HO-1 (▴, solid line). B, real-time kinetic traces of bilirubin production with 0 mg/ml BSA, 1:5 CPR/HO-1 (——); 0 mg/ml BSA, 2:1 CPR/HO-1 (— ·· —); 0.25 mg/ml BSA, 1:5 CPR/HO-1 (— · —); and 0.25 mg/ml BSA, 2:1 CPR/HO-1 (- - -). HO-1 concentration was 0.05 μM for all the assays. Values in A represent the mean ± S.E. of n = 3.
F<sc>ig</sc>. 4.
Fig. 4.
BVR titration and real-time curves of bilirubin production. A, BVRs ranging from 0 to 0.1 μM were analyzed to determine the optimal concentration for bilirubin production at subsaturating and saturating CPR concentrations: 1:5 CPR/HO-1 (□) and 2:1 CPR/HO-1 (▴). B, real-time bilirubin assay curves of the four highest BVR concentrations (0.01–0.1 μM). HO-1 concentration was 0.05 μM for all the assays. Values in A represent the mean ± S.E. of n = 3.
F<sc>ig</sc>. 5.
Fig. 5.
Effect of SOD and catalase on the linearity of the bilirubin formation real-time activity curves. A and B, increasing amounts of superoxide dismutase (0, 0.00025, 0.00125, 0.00625, 0.025, 0.25, 0.625, and 1.25 U/μl) were added to the reaction mixture containing 1:5 (A) and 2:1 (B) CPR/HO-1. C and D, catalase (0, 0.00025, 0.00625, 0.025, 0.25, 0.625, 1.25, and 2.5 U/μl) was titrated into the 1:5 (C) and 2:1 (D) CPR/HO-1 reactions. HO-1 concentration was 0.05 μM for all the reactions.
F<sc>ig</sc>. 6.
Fig. 6.
Effect of H2O2 on HO-1 activity. H2O2 was added to a series of HO-1 reactions containing 2:1 CPR/HO-1 in the absence of catalase. H2O2 concentrations included 0 μM (▵), 5 μM (♦), 15 μM (○), 30 μM (▪), and 60 μM (⋄). Bilirubin formation in the presence of catalase and no exogenous H2O2 was included for comparison (dashed line). Each point represents the average of three determinations.
F<sc>ig</sc>. 7.
Fig. 7.
Generation of H2O2 by full-length and soluble HO-1. H2O2 produced by HO-1 and sHO-1 was measured at various CPR/HO-1 ratios. The HO-1/sHO-1 concentration was 0.5 μM. Low, mid, and high CPR corresponds to a DLPC/CPR reconstituted system (devoid of HO-1) using the same CPR concentrations as those used in the 1:5, 2:1, and 15:1 conditions. N.D. indicates that H2O2 was not detected. Each bar represents the mean ± S.E.M. for three determinations.
F<sc>ig</sc>. 8.
Fig. 8.
DLPC titration of HO-1 in RCS. DLPC levels were varied from 0 to 1200:1 DLPC/HO-1. After the 2-h incubation period at room temperature, the RCSs were assayed by monitoring bilirubin formation at 464 to 530 nm. Shown here are 1:5 CPR/HO-1 (▪) and 2:1 CPR/HO-1 (▵). The HO-1 concentration was 0.05 μM for all the assays. Values represent the mean ± S.E. of n = 3.
F<sc>ig</sc>. 9.
Fig. 9.
Effect of CPR concentration on HO-1 activity. A, time course for bilirubin formation. CPR concentrations included 0 μM (•), 0.0015 μM (○), 0.003 μM (▪), 0.00625 μM (□), 0.0125 μM (▴), 0.025 μM μM (▵), 0.05 μM (♦), and 0.1 μM (⋄). B, the rate of bilirubin formation as a function of CPR concentration. All the assays contained 0.05 μM HO-1. Values in B represent the mean ± S.E. of n = 3.

Similar articles

Cited by

References

    1. Alam J (2002) Heme oxygenase-1: past, present, and future. Antioxid Redox Signal 4 559–562. - PubMed
    1. 'Carra PO and Colleran E (1969) HAEM catabolism and coupled oxidation of haemproteins. FEBS Lett 5 295–298. - PubMed
    1. Causey KM, Eyer CS, and Backes WL (1990) Dual role of phospholipid in the reconstitution of cytochrome P-450 LM2-dependent activities. Mol Pharmacol 38 134–142. - PubMed
    1. Doré S, Takahashi M, Ferris CD, Zakhary R, Hester LD, Guastella D, and Snyder SH (1999) Bilirubin, formed by activation of heme oxygenase-2, protects neurons against oxidative stress injury. Proc Natl Acad Sci U S A 96 2445–2450. - PMC - PubMed
    1. He CH, Gong P, Hu B, Stewart D, Choi ME, Choi AM, and Alam J (2001) Identification of activating transcription factor 4 (ATF4) as an Nrf2-interacting protein. Implication for heme oxygenase-1 gene regulation. J Biol Chem 276 20858–20865. - PubMed

Publication types

LinkOut - more resources