. 2009 Jan;5(1):e1000260.
doi: 10.1371/journal.ppat.1000260. Epub 2009 Jan 9.

Control of stochastic gene expression by host factors at the HIV promoter

Affiliations

Control of stochastic gene expression by host factors at the HIV promoter

John C Burnett et al. PLoS Pathog. 2009 Jan.

Abstract

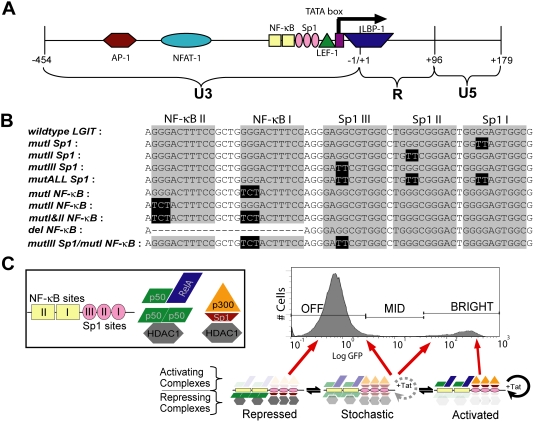
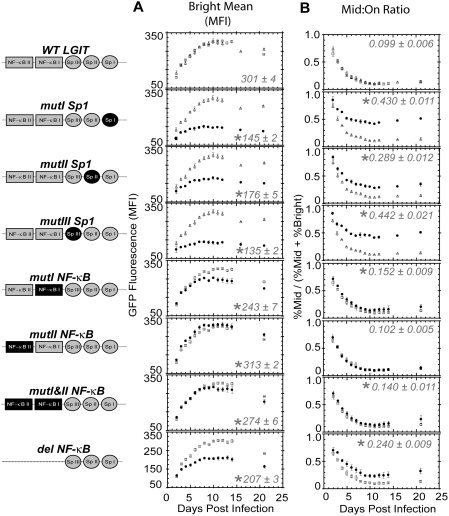
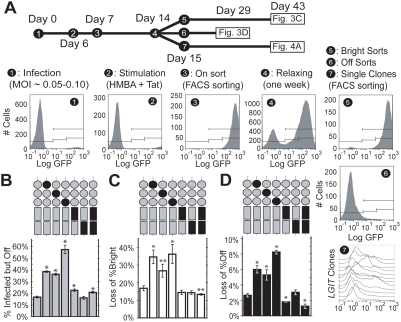
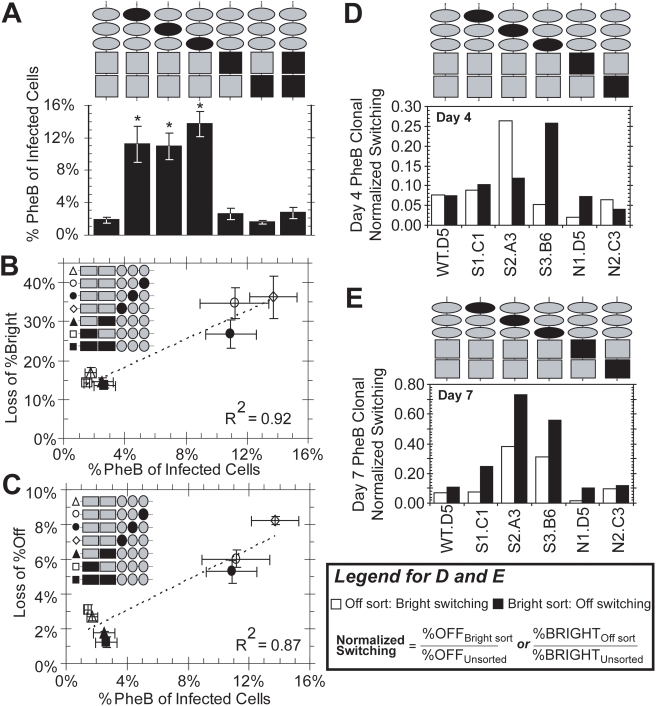
The HIV promoter within the viral long terminal repeat (LTR) orchestrates many aspects of the viral life cycle, from the dynamics of viral gene expression and replication to the establishment of a latent state. In particular, after viral integration into the host genome, stochastic fluctuations in viral gene expression amplified by the Tat positive feedback loop can contribute to the formation of either a productive, transactivated state or an inactive state. In a significant fraction of cells harboring an integrated copy of the HIV-1 model provirus (LTR-GFP-IRES-Tat), this bimodal gene expression profile is dynamic, as cells spontaneously and continuously flip between active (Bright) and inactive (Off) expression modes. Furthermore, these switching dynamics may contribute to the establishment and maintenance of proviral latency, because after viral integration long delays in gene expression can occur before viral transactivation. The HIV-1 promoter contains cis-acting Sp1 and NF-kappaB elements that regulate gene expression via the recruitment of both activating and repressing complexes. We hypothesized that interplay in the recruitment of such positive and negative factors could modulate the stability of the Bright and Off modes and thereby alter the sensitivity of viral gene expression to stochastic fluctuations in the Tat feedback loop. Using model lentivirus variants with mutations introduced in the Sp1 and NF-kappaB elements, we employed flow cytometry, mRNA quantification, pharmacological perturbations, and chromatin immunoprecipitation to reveal significant functional differences in contributions of each site to viral gene regulation. Specifically, the Sp1 sites apparently stabilize both the Bright and the Off states, such that their mutation promotes noisy gene expression and reduction in the regulation of histone acetylation and deacetylation. Furthermore, the NF-kappaB sites exhibit distinct properties, with kappaB site I serving a stronger activating role than kappaB site II. Moreover, Sp1 site III plays a particularly important role in the recruitment of both p300 and RelA to the promoter. Finally, analysis of 362 clonal cell populations infected with the viral variants revealed that mutations in any of the Sp1 sites yield a 6-fold higher frequency of clonal bifurcation compared to that of the wild-type promoter. Thus, each Sp1 and NF-kappaB site differentially contributes to the regulation of viral gene expression, and Sp1 sites functionally "dampen" transcriptional noise and thereby modulate the frequency and maintenance of this model of viral latency. These results may have biomedical implications for the treatment of HIV latency.


Conflict of interest statement

The authors have declared that no competing interests exist.

Figures

Figure 1
Figure 1. Architecture of Sp1 and κB Regulatory Elements within HIV-1 LTR.
(A) Schematic representing the U3, R, and U5 regions of the HIV LTR. Several important transcriptional elements within the U3 region are shown, including the TATA box (−27/−23) and binding elements Sp1 (−55/−46, −66/−57, and −77/−68), κB (−90/−81 and −104/−95), LBP-1 (−16/+27), LEF-1 (−37/−51), NFAT-1 (−254/−216), and AP-1 (−247/−222). (B) Inactivating point mutations in the Sp1 and κB sites were engineered into the LGIT lentiviral plasmid. Mutation sites for κB and Sp1 , were previously described, and primer sequences are supplied in Table S1. Infections of LGIT and mutant lentivirus are detailed in Materials and Methods. (C) A sample bifurcating clonal population of LGIT-infected Jurkats. Gene expression of GFP and Tat is amplified by Tat-transactivation, and the two modes of fluorescence (Off and Bright) correspond to the two states in this genetic circuit (Off and On). We hypothesize that transcriptional bimodality is regulated by repressing and activating complexes, which stabilize Off and Bright modes, respectively. These factors may include repressing histone deacetylase (HDACs, including HDAC1) complexes−recruited by p50-p50 homodimer (at κB sites) and Sp1 protein (at Sp1 sites)−and activating histone acetyltransferases (HATs, including p300)−recruited in conjunction with p50-RelA heterodimer (κB sites) and Sp1 protein (at Sp1 sites). The largely unstable Mid region, which may result from stochastic fluctuations in Tat and switching between Off and Bright states, is regulated by dynamic interplay between repressing and activating complexes. See Figure S6 for further detail.
Figure 2
Figure 2. Sp1 and κB Sites Regulate Off and Bright Dynamics.
(A) Jurkat cells were infected with LGIT and corresponding Sp1 and κB mutants at low MOI (∼0.05–0.10) in biological triplicate (for WT LGIT and Sp1 mutants) or biological quadruplicate (for WT LGIT and κB mutants), and data are the averages of these replicates at each day of the 21-day time course. Shown are the mean of the Bright peak positions (as illustrated in Figure 1C) from the GFP histograms for all time points, as measured by flow cytometry in units of mean fluorescence intensity (MFI). The results from WT LGIT control for two separate experiments (open square or triangle points) are shown together. Data for each mutant (solid circle points) are shown with the corresponding WT LGIT control. Error bars are the standard deviation of the biological quadruplicate or triplicate measurements. Statistically significant differences from WT LGIT are denoted by single asterisks (*, p<0.01). The steady state Bright Mean values at 10 days after infection are shown within each panel. Two LGIT variants (mutALL Sp1 and mutIII Sp1/mutI NF-κB) failed to generate a GFP+ population of cells after infection at low MOI (∼0.05–0.10) and were thus omitted from this study (see Figure S1B). Further details of data analyses are in available in Materials and Methods. (B) The same experiment as in (A), but depicting the fraction of infected and GFP+ cells persisting in the Mid region (Mid:On ratio), in which “On” is the sum of “Mid” and “Bright” regions (Figure 1C), for the duration of the time course. Error bars are the standard deviation of the biological quadruplicate or triplicate measurements. Statistically significant differences from WT LGIT are denoted by single asterisks (*, p<0.01). The “steady state” Mid:On values at 10 days after infection are shown within each panel.
Figure 3
Figure 3. Sp1 Sites Regulate Fraction of Infected but Off Dynamic Switching.
(A) Jurkat cells were infected with either LGIT, mutI Sp1, mutII Sp1, mutIII Sp1, mutI NF-κB, mutII NF-κB, or mutI&II NF-κB lentivirus at low MOI (∼0.05-0.10) (panel 1). Six days post-infection, LGIT gene expression was stimulated with HMBA and exogenous Tat protein (panel 2). Eighteen hours after stimulation, GFP+ cells were sorted with FACS to isolate infected from uninfected cells (panel 3), and cells were then cultured under normal conditions for one week to allow relaxation of expression levels (panel 4). After relaxing into Off and Bright peaks, FACS sorting was used to isolate the polyclonal Bright fraction (panel 5), the polyclonal Off fraction (panel 6), and individual clones (panel 7). (B) Infected but Off cells persist in the Off state in unstimulated conditions. Cells infected with WT LGIT, mutI Sp1, mutII Sp1, mutIII Sp1, mutI NF-κB, mutII NF-κB, and mutI&II NF-κB were stimulated with HMBA and exogenous Tat protein to determine the total number of infected cells (Figure 3A, panel 2). Shown are the fractions of infected cells that persist in the Off state (%Infected but Off). These data are calculated by the simple formula: %Off_infected = (1−%On_unstimulated)/(%On_stimulated). All data are averages of biological triplicates, and error bars are standard deviations. Statistically significant differences from WT LGIT are denoted by single asterisks (*, p<0.01). (C) Bright-sorted LGIT cells spontaneously inactivate into the Off mode under normal culturing conditions. Bright-sorted populations (Figure 3A, panel 5) were cultured for 14 days after FACS sorting to quantify the stability of the Bright mode. As analyzed by flow cytometry, a fraction of Bright-sorted cells relaxed out of the Bright mode, which is indicated by “Loss of %Bright.” Error bars are standard deviations of triplicate measurements. Statistically significant differences from WT LGIT are denoted by single asterisks (*, p<0.01). (D) Off-sorted LGIT cells spontaneously activate into the Bright mode under normal culturing conditions. Off-sorted populations (Figure 3A, panel 6) were cultured for 28 days after FACS sorting to quantify the stability of the Off mode. As analyzed by flow cytometry, a fraction of Off-sorted cells activated from the Off mode, which is indicated by “Loss of %Off.” Error bars are standard deviations of triplicate measurements, and statistically significant differences from WT LGIT are denoted by single asterisks (*, p<0.01).
Figure 4
Figure 4. Sp1 Sites Regulate Phenotypic Bifurcation and Transcriptional Dynamics.
(A) Clonal populations phenotypically bifurcate (PheB) into Off and Bright modes. Clonal FACS-sorting was performed to isolate single cells from LGIT, mutI Sp1, mutII Sp1, mutIII Sp1, mutI NF-κB, mutII NF-κB, and mutI&II NF-κB infected populations (Figure 3A, panel 7). Each single cell was expanded as a clonal population to achieve least 106 cells and analyzed by flow cytometry to measure GFP expression. PheB was defined as a clonal population having more than 0.5% of cells in each of the “Off” and “Bright” gates after four weeks of expansion in normal culturing conditions. In total, 362 LGIT and LGIT mutant clones were sorted, expanded, and analyzed. Of these, 190 exhibited PheB behavior in GFP gene expression. To determine statistical variance for each mutant, qualification for each clone (either PheB or non-PheB) from each mutant were randomly placed into one of three bins, and the error bars represent the standard deviations for the three bins. (B) Correlation of spontaneous inactivation (Figure 3C) and Phenotypic Bifurcation (A). Together, these data show the correlation between the stability of the Bright mode (Loss of %Bright) and the degree of transcriptional noise (%PheB). (C) Correlation of spontaneous activation (Figure 3D) and Phenotypic Bifurcation (A). Similarly to (B), these data show the correlation between the stability of the Off mode (Loss of %Off) and the degree of transcriptional noise (%PheB). (D) Off and Bright fractions of one phenotypically bifurcating (PheB) clone from each LGIT variant were isolated with FACS (Figure S2). Four days after sorting, Off and Bright sorts were analyzed by flow cytometry to measure the extent of dynamic switching. Each “normalized switching” value is the fraction of cells that have switched into the specified region divided by the fraction of cells in that region for the unsorted population. White bars indicate the switching of Off sorts into the Bright region, and black bars indicate the switching of Bright sorts into the Off region. (E) The same as in (D) with flow cytometry analyses performed seven days after FACS sorting. White bars indicate the switching of Off sorts into the Bright region, and black bars indicate the switching of Bright sorts into the Off region. Histograms are provided in Figure S2.
Figure 5
Figure 5. Perturbations of Sp1 and κB Mutants.
(A) Stimulation with TNF-α or TSA increases the Bright Mean. Unsorted populations infected with LGIT, mutI Sp1, mutII Sp1, mutIII Sp1, mutI NF-κB, mutII NF-κB, and mutI&II NF-κB (same as in Figure 2) were stimulated with TNF-α (gray bars) or TSA (black bars) two weeks after infection. The Bright Mean position of stimulated cells and control (unperturbed) cells was measured by flow cytometry 18 hours after stimulation. Notably, no significant change in the Bright Mean was observed for mutI&II NF-κB upon TNF-α stimulation, confirming that the κB mutations abrogate NF-κB-mediated activation. The Normalized Bright Mean for LGIT and all LGIT variants was normalized by the unstimulated Bright Mean for each corresponding variant (see Figure 2A). Raw data for these measurements are provided in Table S4. All data are averages of biological triplicates, and error bars are standard deviations. Histograms of these perturbations are presented in Figure S1B. Statistically significant differences from WT LGIT are denoted by single asterisks (*, p<0.01) and double asterisks (**, p<0.05). (B) Stimulation with TNF-α or TSA activates the infected cells that persist in the Off state in unstimulated conditions. Cells were prepared to isolate the fraction of “Infected but Off” cells by serial FACS sorting (Figure 3A, panel 6). At day 17 post-infection and three days after FACS sorting from the Off region, cells were stimulated with TNF-α or TSA. The data are the fraction of Off-sorted cells that activate into the On region after stimulation. Flow cytometry measurements were performed 18 hours after stimulation. All data are averages of biological triplicates, and error bars are standard deviations. Statistically significant differences from WT LGIT are denoted by single asterisks (*, p<0.01).
Figure 6
Figure 6. Occupancy of Sp1 and κB Sites in Bright and Off States.
(A) Flow cytometry histograms of expanded populations of Off- and Bright-sorted Jurkats infected with LGIT and each LGIT mutant (as in Figure 3A, panels 5–6). 106 cells were initially sorted from Off and Bright regions, and seven days of expansion was conducted to achieve 5×10⁷ cells necessary for this ChIP protocol. We observed a moderate extent of Bright→Off and Off→Bright dynamic switching over this one-week expansion. (B) RelA ChIP results for Off- and Bright-sorted populations of LGIT, mutI Sp1, mutII Sp1, mutIII Sp1, mutI NF-κB, and mutII NF-κB. Immunoprecipitations were performed using RelA antibody, and immunoprecipitated DNA was quantified using QPCR with primers against the HIV LTR. For analysis of input DNA and RelA immunoprecipitation, all LTR QPCR measurements were normalized by with ChIP-QPCR measurements for the endogenous TAP1/LMP2 regulatory domain , which contains single κB and Sp1 sites that recruit RelA and p50 (refer to Figure S4A and S4B for non-normalized results). Primer sequences and QPCR conditions for HIV LTR and TAP1/LMP2 are supplied in Materials and Methods and Table S2. The QPCR measurements for LTR and control TAP1/LMP2 were performed in triplicate, and error bars are standard deviations. Statistically significant differences from WT LGIT are denoted by black single asterisks (*, p<0.05), and significant differences between the Off and Bright sorts for any particular mutant is denoted by gray double asterisks (**, p<0.05). (C) p300 ChIP results for Off- and Bright-sorted populations of LGIT, mutI Sp1, mutII Sp1, mutIII Sp1, mutI NF-κB, and mutII NF-κB. Immunoprecipitations were performed using a p300 antibody, and QPCR measurements were normalized by the endogenous BCL2L1 regulatory domain , which contains Sp1 elements and has been shown to recruit p300 and Sp1 (refer to Figure S4C for non-normalized results). The QPCR measurements for LTR and control BCL2L1 were performed in triplicate, and error bars are standard deviations. Statistics analyses are the same as in (B). (D) The same experiments as in (C) with a Sp1 antibody. Off- and Bright-sorted populations of LGIT, mutI Sp1, mutII Sp1, mutIII Sp1, and mutI NF-κB were examined for the presence of Sp1, and QPCR measurements were normalized by the BCL2L1 regulatory domain (refer to Figure S4D for non-normalized results). mutII NF-κB was not performed, as denoted by “NP.” Statistics analyses are the same as in (B). (E) HDAC1 ChIP results for Off- and Bright-sorted populations of LGIT, mutI Sp1, mutII Sp1, mutIII Sp1, mutI NF-κB, and mutII NF-κB. QPCR measurements were normalized by the input DNA. Statistics are the same as in (B). (F) Acetylated histone 3 (lysines 9 and 14) for Off- and Bright-sorted populations of LGIT, mutI Sp1, mutII Sp1, mutIII Sp1, mutI NF-κB, and mutII NF-κB. Total histone 3 (H3) was also quantified by ChIP, and the presented data are the ratios of these QPCR measurements (AcH3/H3). Statistics are the same as in (B). (G) Real time RT-PCR analysis on initiated and fully elongated transcripts for Off-sorted LGIT, mutIII Sp1, mutI NF-κB, and mutII NF-κB cell populations. Off sorts were performed as in Figure 6A, and cells were expanded for approximately one week before mRNA extraction. Details for mRNA preparation QPCR are in Materials and Methods and calculations of measurements are discussed in Figure S5. Initiated transcripts were detected with primers for TAR, and elongated transcripts were detected with primers for Tat. Since mutI Sp1 and mutII Sp1 did not suggest altered occupancy of p50-RelA heterodimer or p50-p50 homodimer from ChIP experiments, these were not performed. Statistically significant differences from WT LGIT are denoted by single asterisks (*, p<0.01). (H) The same experiments as in (G) performed on Bright-sorted LGIT, mutIII Sp1, mutI NF-κB, and mutII NF-κB. Bright sorts were performed as in Figure 6A.
Figure 7
Figure 7. Model of Sp1 and κB Occupancy in Off, Bright, and Intermediate Regions.
This cartoon model proposes the localization of chromatin factors to the Sp1 and κB sites within the HIV-1 LTR. The NF-κB dimers (p50-p50 or p50-RelA) lead to differential recruitment of HDAC1 or p300, respectively. Likewise, the Sp1 protein has been demonstrated to recruit either activating HATs (such as p300) or repressing HDACs (such as HDAC1). The structural conformation and association with either HDAC1 or p300 may govern the DNA-binding affinity of Sp1, and we have illustrated these two conformations by the orientation of the Sp1 molecule (maroon trapezoid). Other symbols include p300 (orange triangle), RelA (blue parallelogram), p50 (green rhombus), and HDAC1 (gray hexagon). The localization of repressing factors (illustrated below Sp1 and κB elements) is enhanced in the Off mode and the presences of activating factors (above Sp1 and κB elements) is enhanced in the Bright mode. Note that κB site I and Sp1 site III recruit RelA and p300, respectively, and these two sites appear to have an important synergistic and/or cooperative role in transcriptional activation.

References

    1. Blankson JN, Persaud D, Siliciano RF. The challenge of viral reservoirs in HIV-1 infection. Annu Rev Med. 2002;53:557–593. - PubMed
    1. Zhou M, Halanski MA, Radonovich MF, Kashanchi F, Peng J, et al. Tat modifies the activity of CDK9 to phosphorylate serine 5 of the RNA polymerase II carboxyl-terminal domain during human immunodeficiency virus type 1 transcription. Mol Cell Biol. 2000;20:5077–5086. - PMC - PubMed
    1. Williams SA, Chen LF, Kwon H, Ruiz-Jarabo CM, Verdin E, et al. NF-κB p50 promotes HIV latency through HDAC recruitment and repression of transcriptional initiation. EMBO J. 2006;25:139–149. - PMC - PubMed
    1. Gatignol A, Buckler-White A, Berkhout B, Jeang KT. Characterization of a human TAR RNA-binding protein that activates the HIV-1 LTR. Science. 1991;251:1597–1600. - PubMed
    1. Fujinaga K, Cujec TP, Peng J, Garriga J, Price DH, et al. The ability of positive transcription elongation factor B to transactivate human immunodeficiency virus transcription depends on a functional kinase domain, cyclin T1, and Tat. J Virol. 1998;72:7154–7159. - PMC - PubMed

Publication types