

Mouse genome-wide association mapping needs linkage analysis to avoid false-positive Loci
- PMID: 19132132
- PMCID: PMC2614123
- DOI: 10.1371/journal.pgen.1000331
Mouse genome-wide association mapping needs linkage analysis to avoid false-positive Loci
Abstract
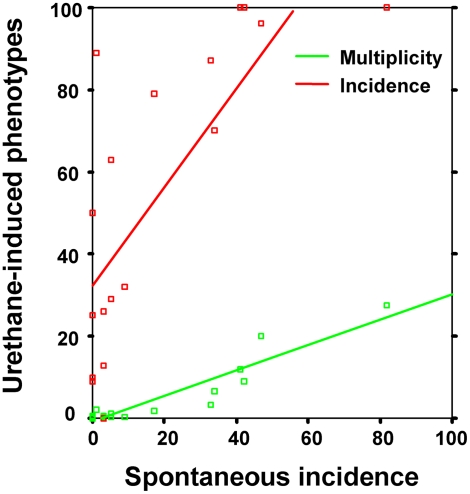
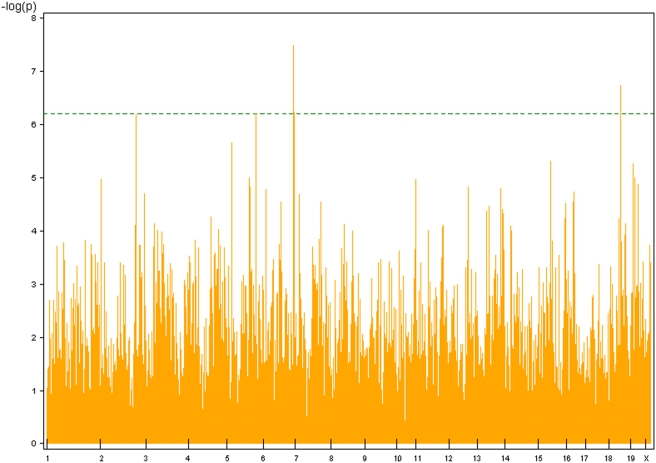
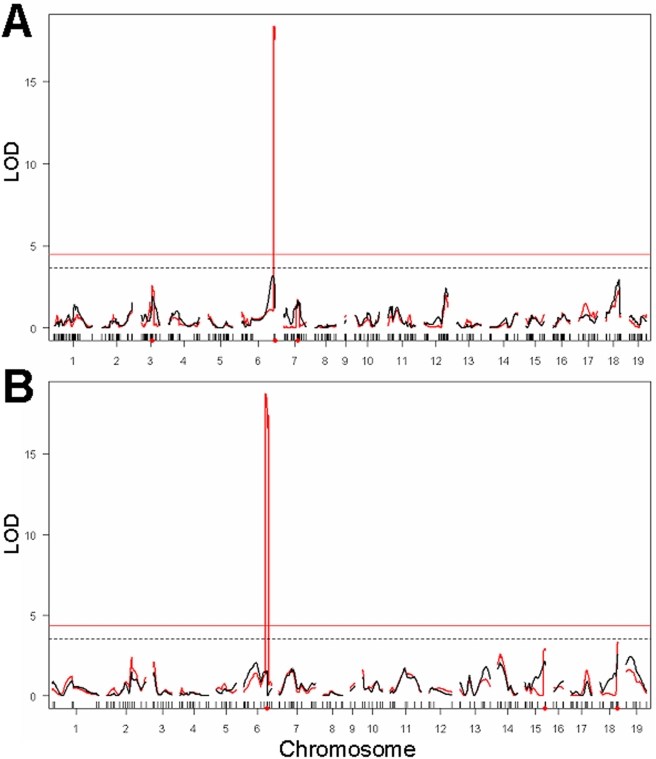
We carried out genome-wide association (GWA) studies in inbred mouse strains characterized for their lung tumor susceptibility phenotypes (spontaneous or urethane-induced) with panels of 12,959 (13K) or 138,793 (140K) single-nucleotide polymorphisms (SNPs). Above the statistical thresholds, we detected only SNP rs3681853 on Chromosome 5, two SNPs in the pulmonary adenoma susceptibility 1 (Pas1) locus, and SNP rs4174648 on Chromosome 16 for spontaneous tumor incidence, urethane-induced tumor incidence, and urethane-induced tumor multiplicity, respectively, with the 13K SNP panel, but only the Pas1 locus with the 140K SNP panel. Haplotype analysis carried out in the latter panel detected four additional loci. Loci reported in previous GWA studies failed to replicate. Genome-wide genetic linkage analysis in urethane-treated (BALB/cxC3H/He)F2, (BALB/cxSWR/J)F2, and (A/JxC3H/He)F2 mice showed that Pas1, but none of the other loci detected previously or herein by GWA, had a significant effect. The Lasc1 gene, identified by GWA as a functional element (Nat. Genet., 38:888-95, 2006), showed no genetic effects in the two independent intercross mouse populations containing both alleles, nor was it expressed in mouse normal lung or lung tumors. Our results indicate that GWA studies in mouse inbred strains can suffer a high rate of false-positive results and that such an approach should be used in conjunction with classical linkage mapping in genetic crosses.
Conflict of interest statement
The authors have declared that no competing interests exist.
Figures
Similar articles
-
Complex genetic control of lung tumorigenesis in resistant mice strains.Cancer Sci. 2017 Nov;108(11):2281-2286. doi: 10.1111/cas.13349. Epub 2017 Oct 6. Cancer Sci. 2017. PMID: 28796413 Free PMC article.
-
Multigenic nature of the mouse pulmonary adenoma progression 1 locus.BMC Genomics. 2013 Mar 6;14:152. doi: 10.1186/1471-2164-14-152. BMC Genomics. 2013. PMID: 23497166 Free PMC article.
-
Fine mapping and identification of candidate pulmonary adenoma susceptibility 1 genes using advanced intercross lines.Cancer Res. 2003 Jun 15;63(12):3317-24. Cancer Res. 2003. PMID: 12810665
-
Genetic mapping of cancer susceptibility/resistance loci in the mouse.Recent Results Cancer Res. 1998;154:292-7. doi: 10.1007/978-3-642-46870-4_20. Recent Results Cancer Res. 1998. PMID: 10027009 Review.
-
Polygenic resistance to mouse pulmonary adenomas.Exp Lung Res. 2000 Dec;26(8):617-25. doi: 10.1080/01902140150216701. Exp Lung Res. 2000. PMID: 11195459 Review.
Cited by
-
An experimental assessment of in silico haplotype association mapping in laboratory mice.BMC Genet. 2009 Dec 9;10:81. doi: 10.1186/1471-2156-10-81. BMC Genet. 2009. PMID: 20003225 Free PMC article.
-
Linkage and association mapping of Arabidopsis thaliana flowering time in nature.PLoS Genet. 2010 May 6;6(5):e1000940. doi: 10.1371/journal.pgen.1000940. PLoS Genet. 2010. PMID: 20463887 Free PMC article.
-
Allelic variation in a cellulose synthase gene (PtoCesA4) associated with growth and wood properties in Populus tomentosa.G3 (Bethesda). 2013 Nov 6;3(11):2069-84. doi: 10.1534/g3.113.007724. G3 (Bethesda). 2013. PMID: 24048648 Free PMC article.
-
Identification of Padi2 as a novel angiogenesis-regulating gene by genome association studies in mice.PLoS Genet. 2017 Jun 15;13(6):e1006848. doi: 10.1371/journal.pgen.1006848. eCollection 2017 Jun. PLoS Genet. 2017. PMID: 28617813 Free PMC article.
-
Identification of fat4 and tsc22d1 as novel candidate genes for spontaneous pulmonary adenomas.Cancer Res. 2011 Sep 1;71(17):5779-91. doi: 10.1158/0008-5472.CAN-11-1418. Epub 2011 Jul 15. Cancer Res. 2011. PMID: 21764761 Free PMC article.
References
-
- Chapman NH, Thompson EA. Linkage disequilibrium mapping: the role of population history, size, and structure. Adv Genet. 2001;42:413–437. - PubMed
-
- Abecasis GR, Ghosh D, Nichols TE. Linkage disequilibrium: ancient history drives the new genetics. Hum Hered. 2005;59:118–124. - PubMed
-
- Manenti G, Galbiati F, Giannì-Barrera R, Pettinicchio A, Acevedo A, et al. Haplotype sharing suggests that a genomic segment containing six genes accounts for the pulmonary adenoma susceptibility 1 (Pas1) locus activity in mice. Oncogene. 2004;23:4495–4504. - PubMed
-
- Manenti G, Dragani TA. Pas1 haplotype-dependent genetic predisposition to lung tumorigenesis in rodents: a meta-analysis. Carcinogenesis. 2005;26:875–882. - PubMed
Publication types
MeSH terms
Substances
LinkOut - more resources
Full Text Sources
Medical
Molecular Biology Databases
Miscellaneous
