. 2009 Mar 15;386(2):194-216.
doi: 10.1016/j.ab.2008.11.021. Epub 2008 Nov 27.

A global benchmark study using affinity-based biosensors

Rebecca L Rich  1 Giuseppe A PapaliaPeter J FlynnJamie FurneisenJohn QuinnJoshua S KleinPhini S KatsambaM Brent WaddellMichael ScottJoshua ThompsonJudie BerlierSchuyler CorryMireille BaltzingerGabrielle Zeder-LutzAndreas SchoenemannAnca ClabbersSebastien WieckowskiMary M MurphyPhillip PageThomas E RyanJay DuffnerTanmoy GangulyJohn CorbinSatyen GautamGregor AnderluhAndrej BavdekDana ReichmannSatya P YadavEric HommemaEwa PolAndrew DrakeScott KlakampTrevor ChapmanDawn KernaghanKen MillerJason SchumanKevin LindquistKara HerlihyMichael B MurphyRichard BohnsackBruce AndrienPietro BrandaniDanny TerweyRohn MillicanRyan J DarlingLiann WangQuincy CarterJoe DotzlafJacinto Lopez-SagasetaIslay CampbellPaola TorreriSylviane HoosPatrick EnglandYang LiuYasmina AbdicheDaniel MalashockAlanna PinkertonMelanie WongEileen LaferCynthia HinckKevin ThompsonCarmelo Di PrimoAlison JoyceJonathan BrooksFederico TortaAnne Birgitte Bagge HagelJanus KrarupJesper PassMonica FerreiraSergei ShikovMalgorzata MikolajczykYuki AbeGaetano BarbatoAnthony M GiannettiGaneshram KrishnamoorthyBianca BeusinkDaulet SatpaevTiffany TsangEric FangJames PartridgeStephen BrohawnJames HornOtto PritschGonzalo ObalSanjay NilapwarBen BusbyGerardo Gutierrez-SanchezRuchira Das GuptaSylvie CanepaKrista WitteZaneta Nikolovska-ColeskaYun Hee ChoRoberta D'AgataKristian SchlickRosy CalvertEva M MunozMaria Jose HernaizTsafir BravmanMonica DinesMin-Hsiang YangAgnes PuskasErica BoniJiejin LiMartin WearAsya GrinbergJason BaardsnesOlan DolezalMelicia GaineyHenrik AndersonJinlin PengMark LewisPeter SpiesQuyhn TrinhSergei BibikovJill RaymondMohammed YousefVidya ChandrasekaranYuguo FengAnne EmerickSuparna MundodoRejane GuimaraesKaty McGirrYue-Ji LiHeather HughesHubert MantzRostislav SkrabanaMark WitmerJoshua BallardLoic MartinPetr SkladalGeorge KorzaIte Laird-OffringaCharlene S LeeAbdelkrim KhadirFrank PodlaskiPhillippe NeunerJulie RothackerAshique RafiqueNico DankbarPeter KainzErk GedigMomchilo VuyisichChristina BoozerNguyen LyMark ToewsAykut UrenOleksandr KalyuzhniyKenneth LewisEugene ChomeyBrian J PakDavid G Myszka
Affiliations

A global benchmark study using affinity-based biosensors

Rebecca L Rich et al. Anal Biochem. .

Abstract

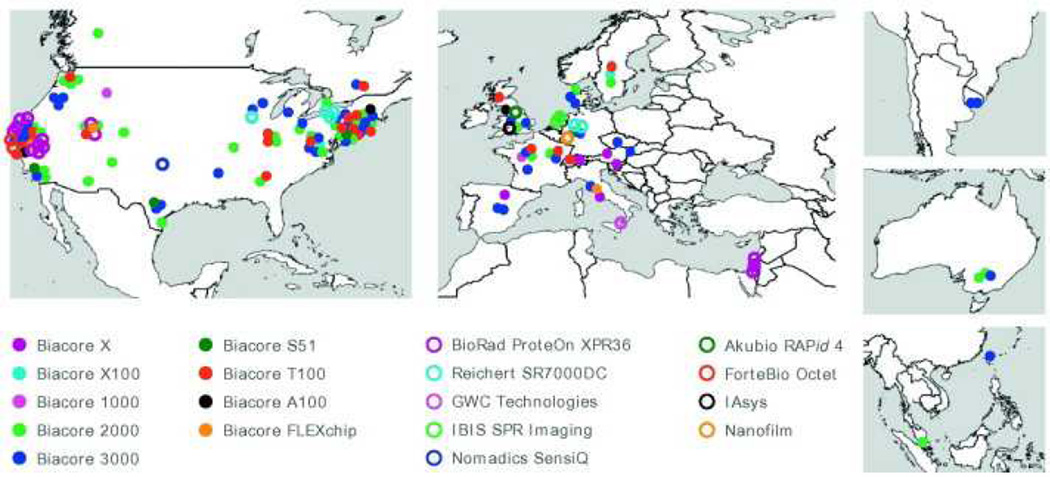
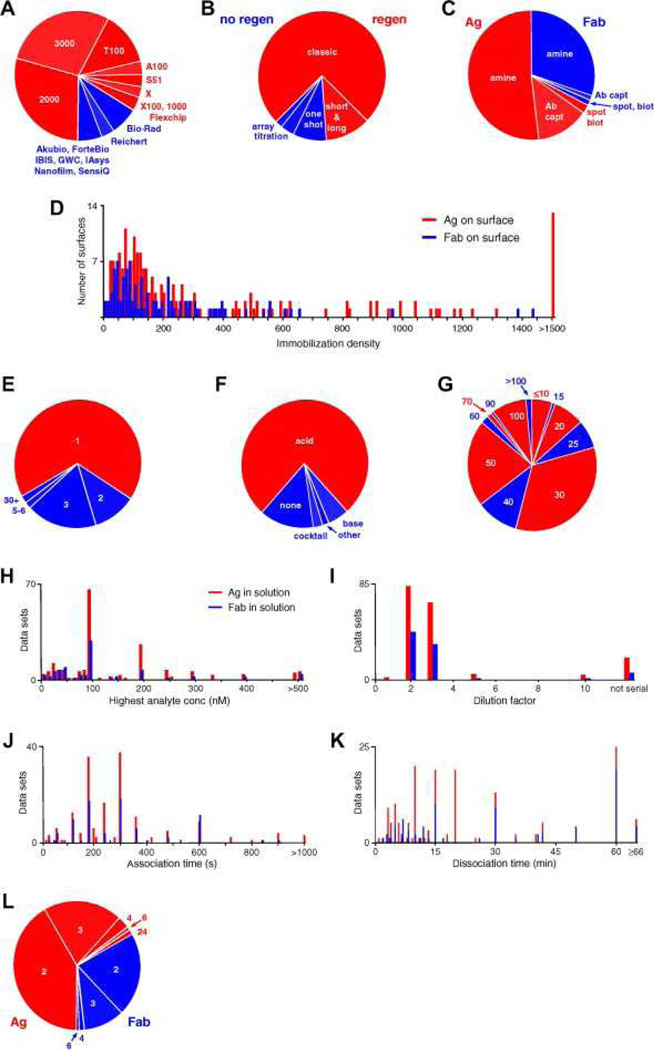
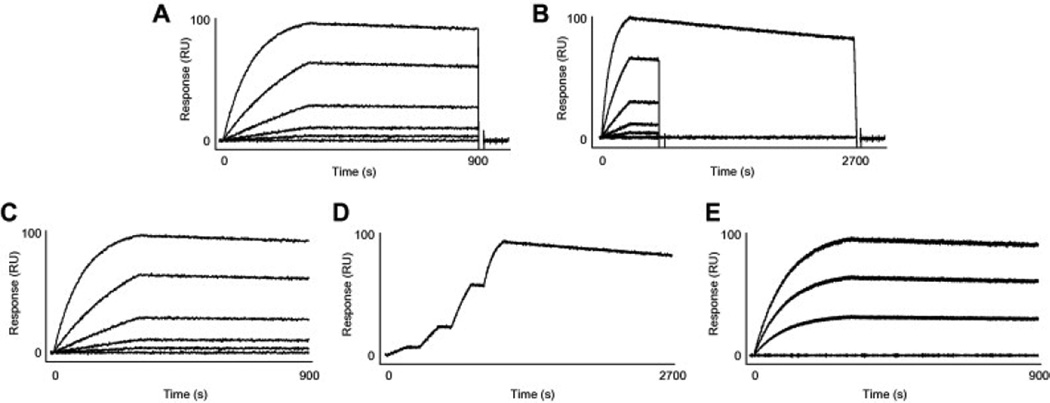
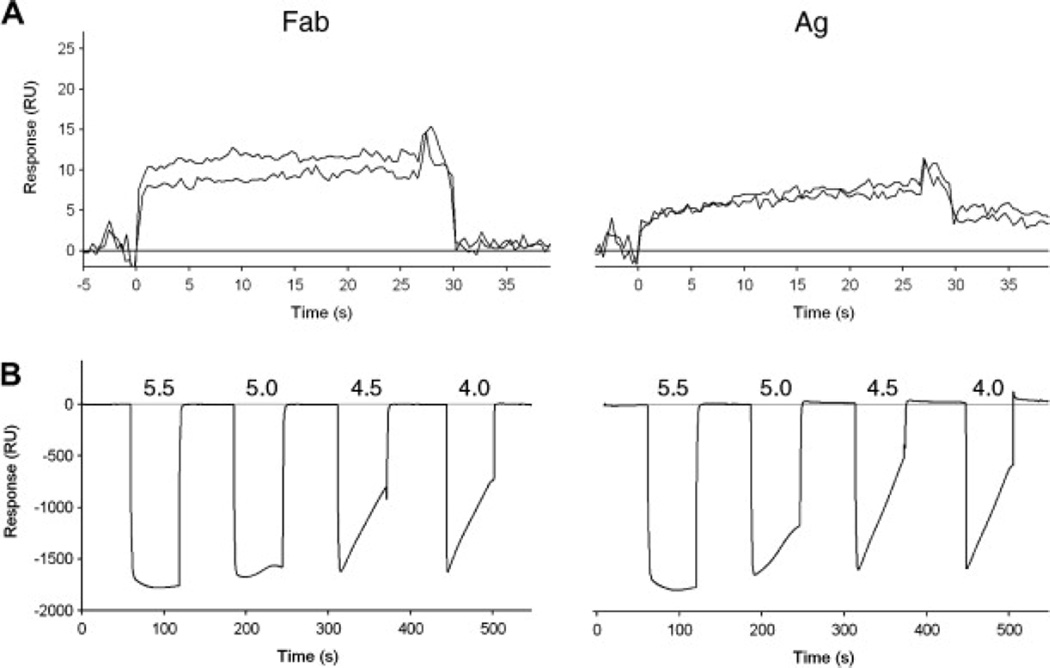
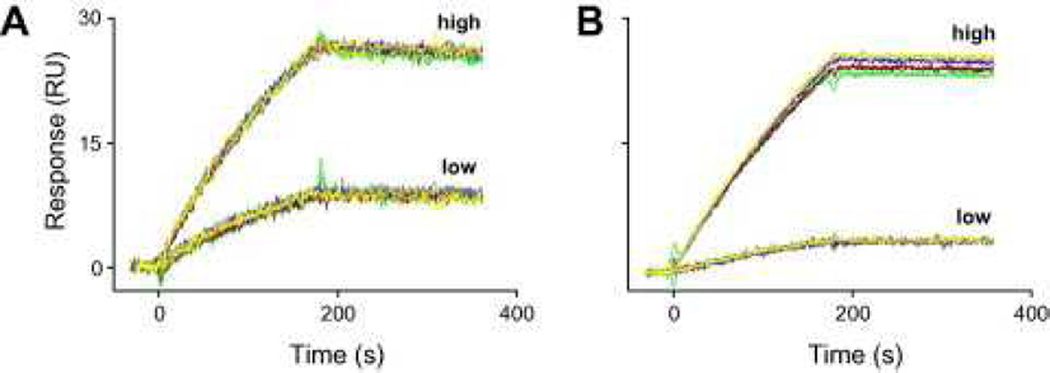
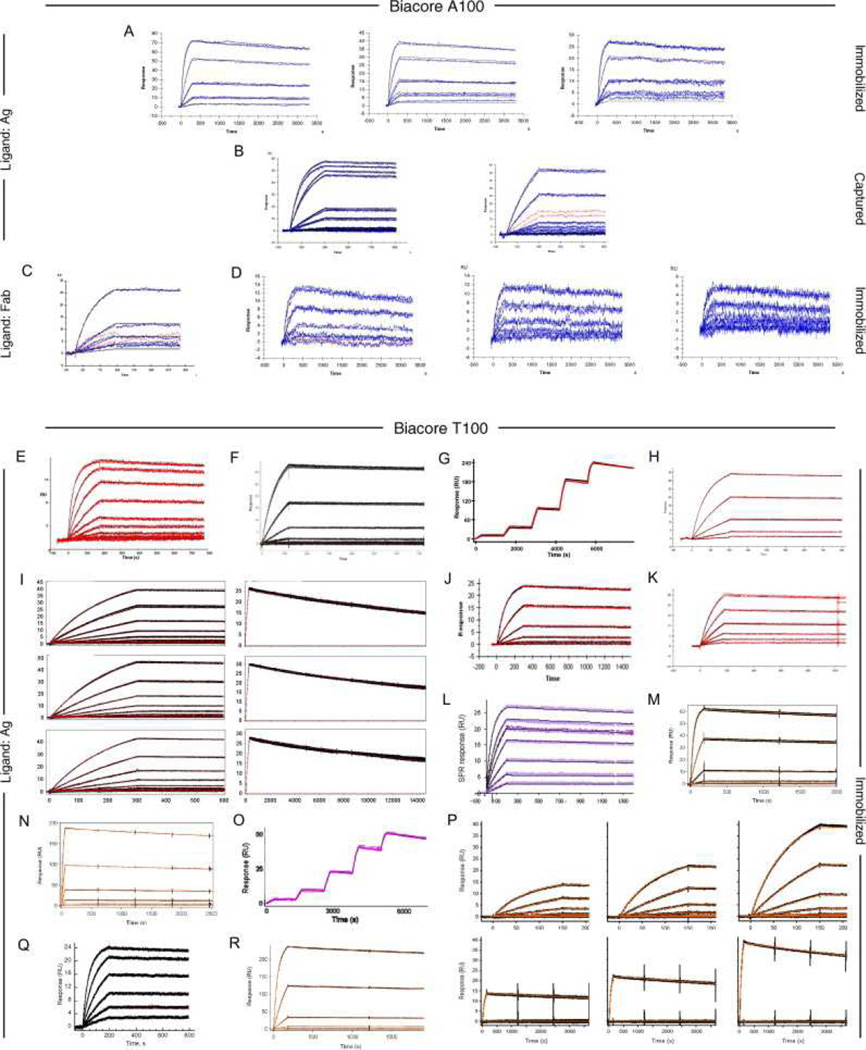
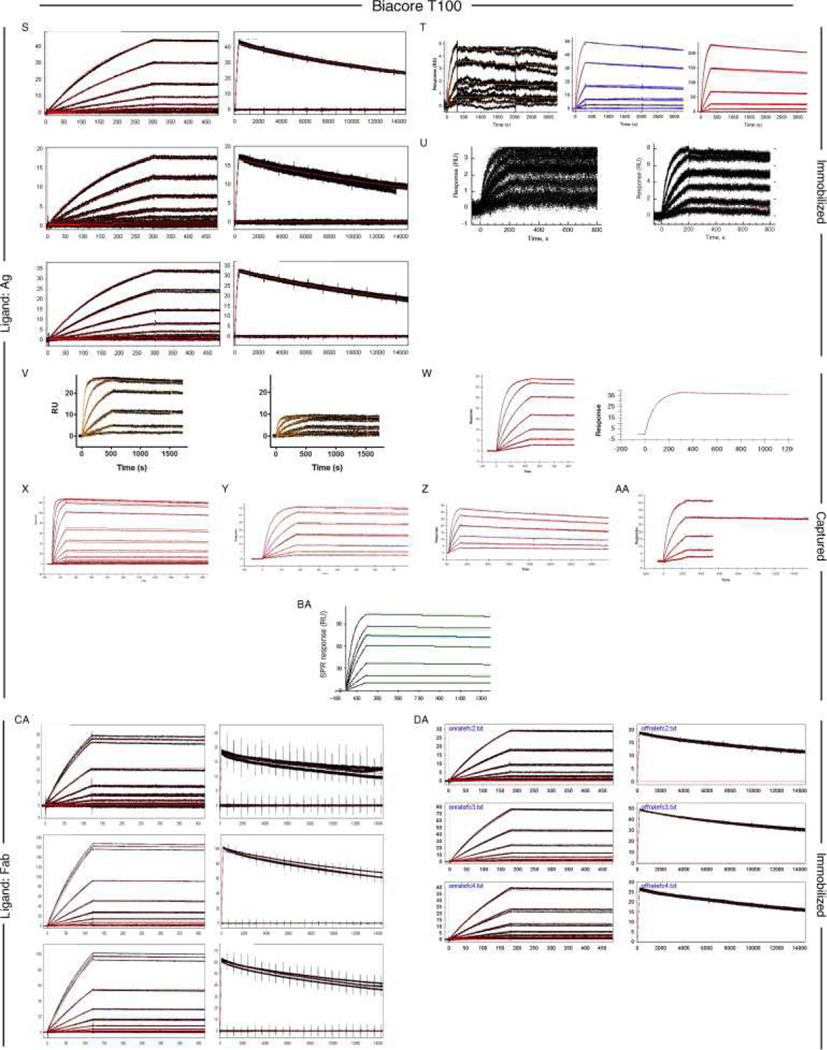
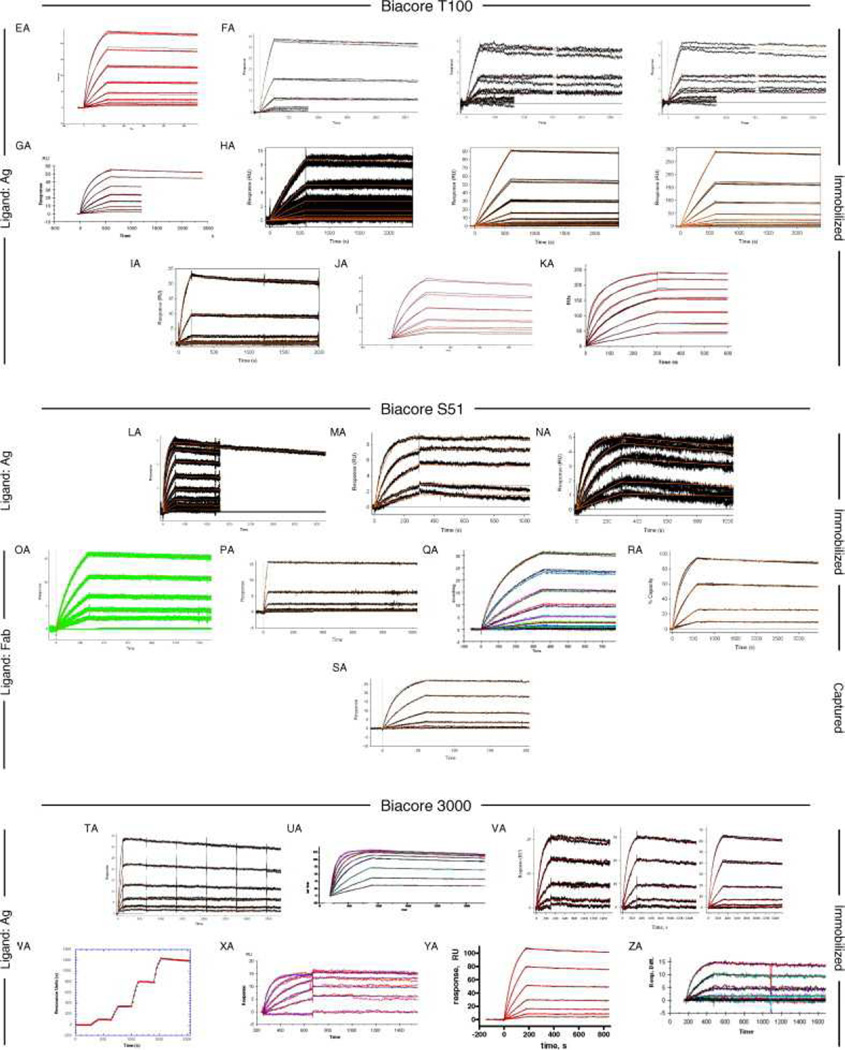
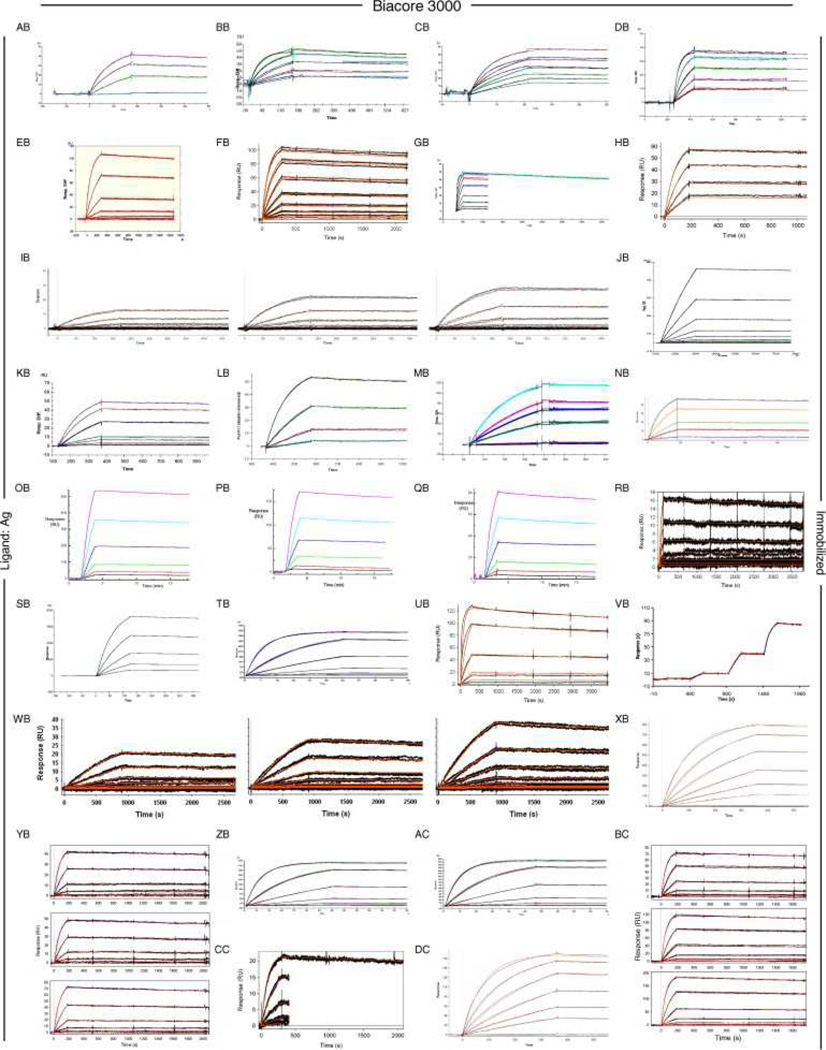
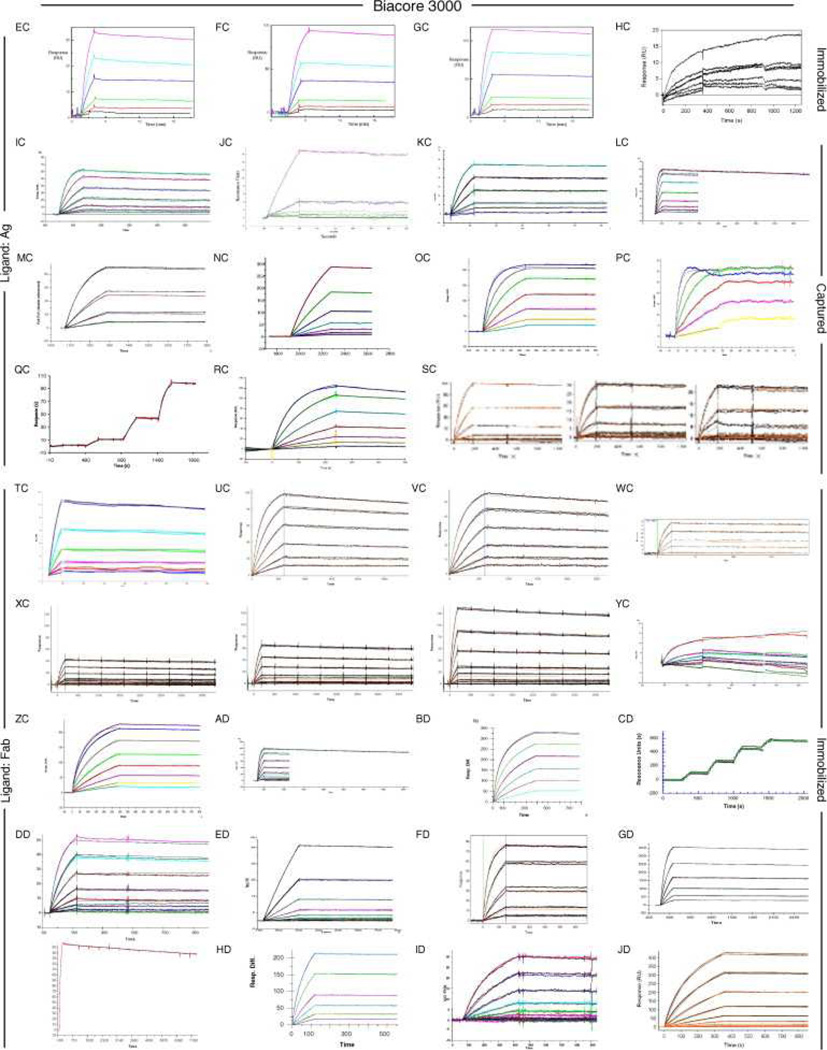
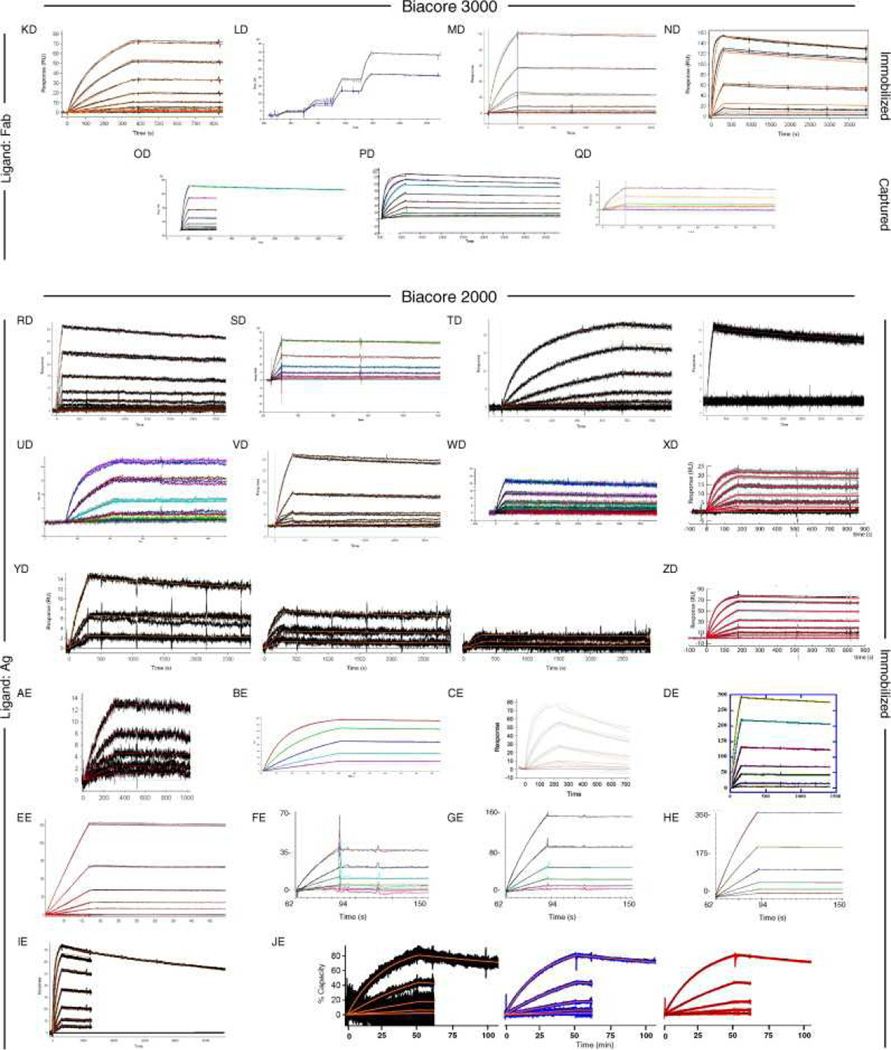
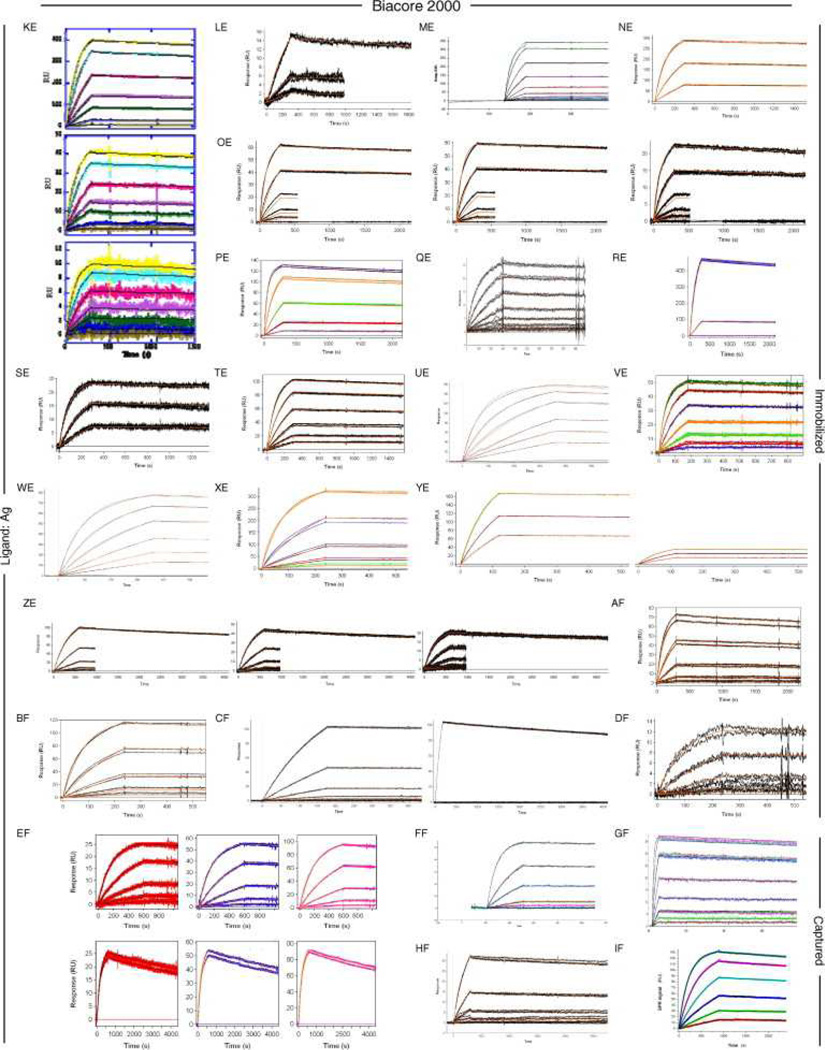
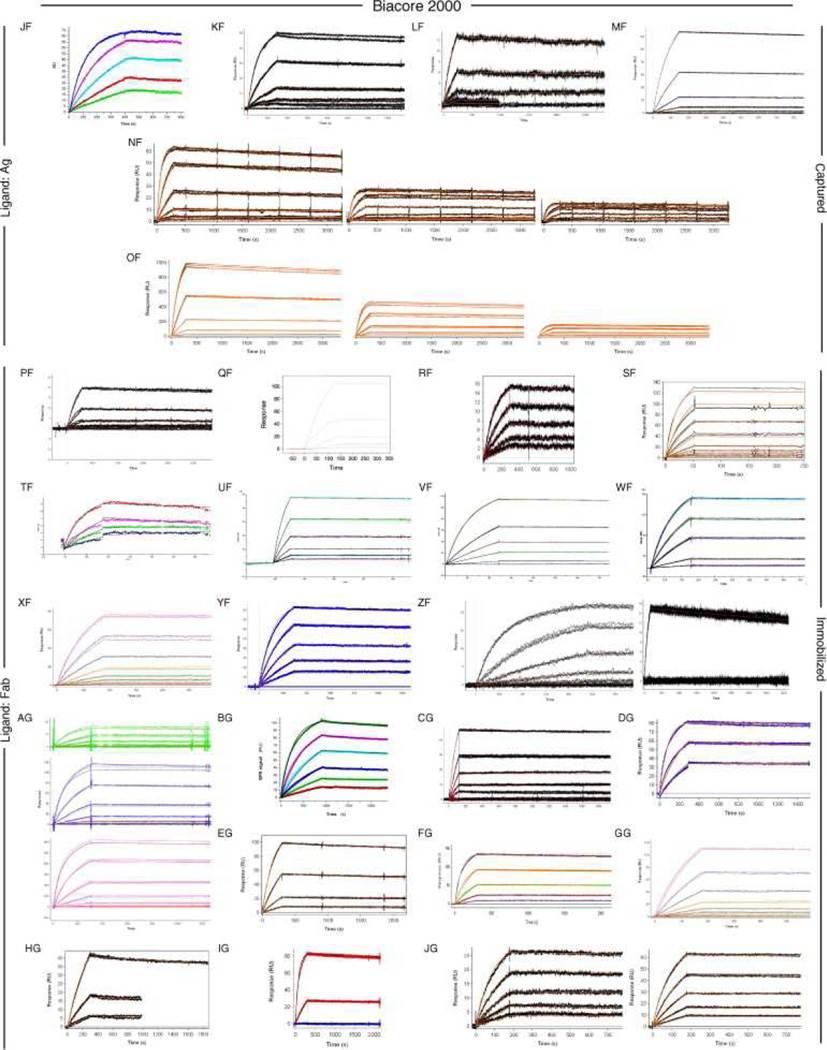
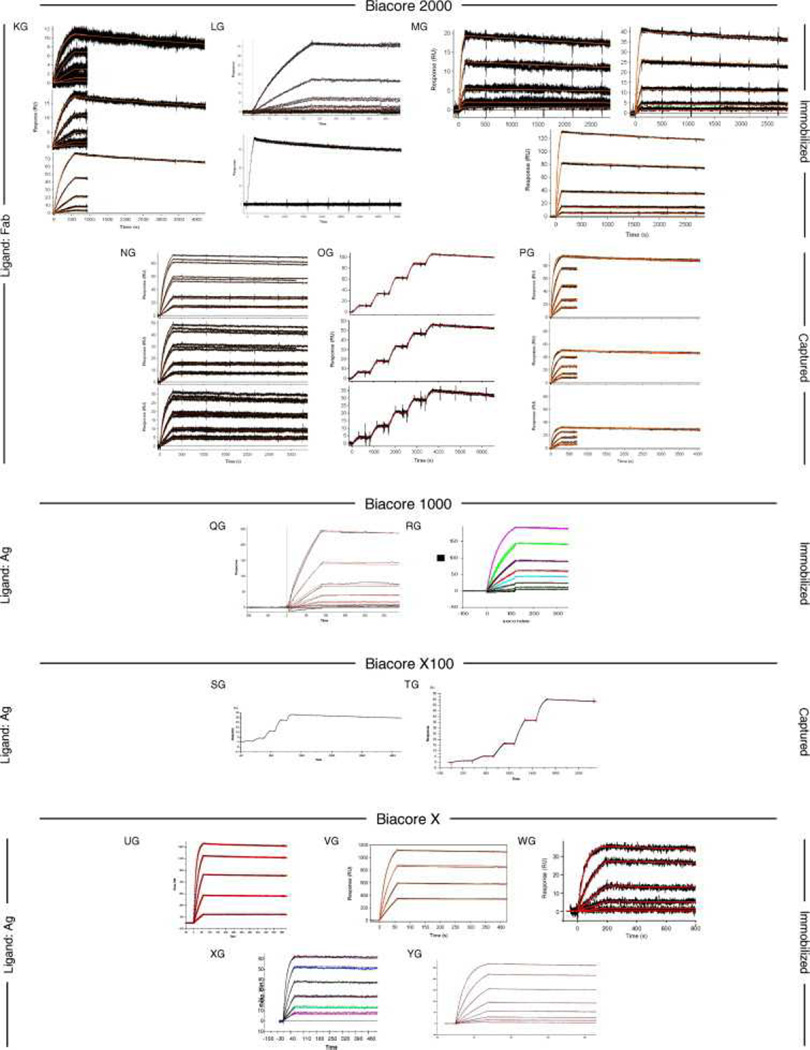
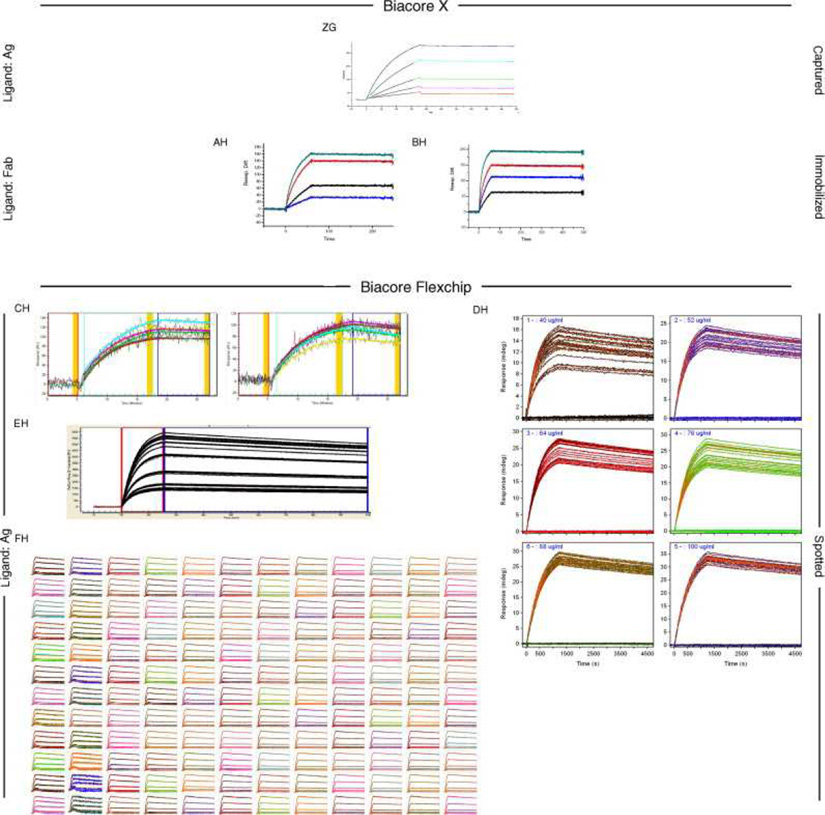
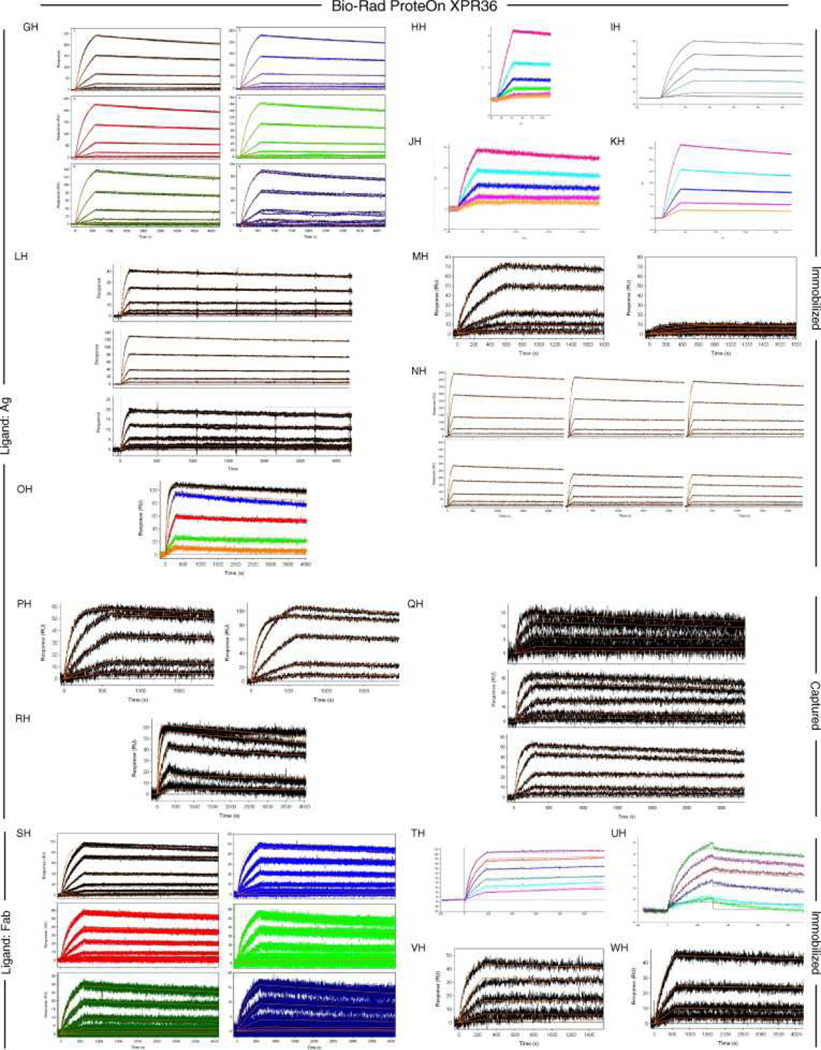
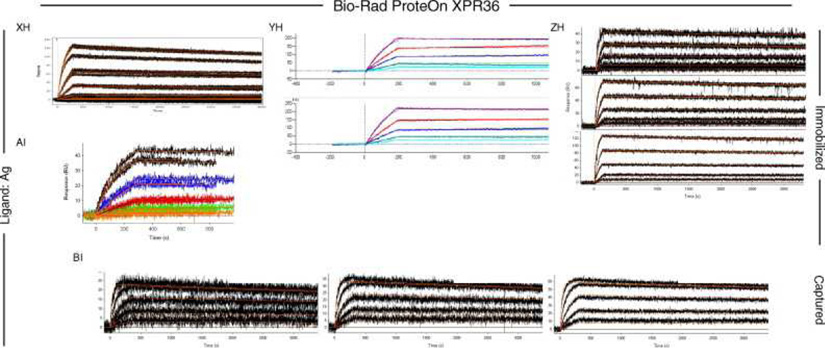
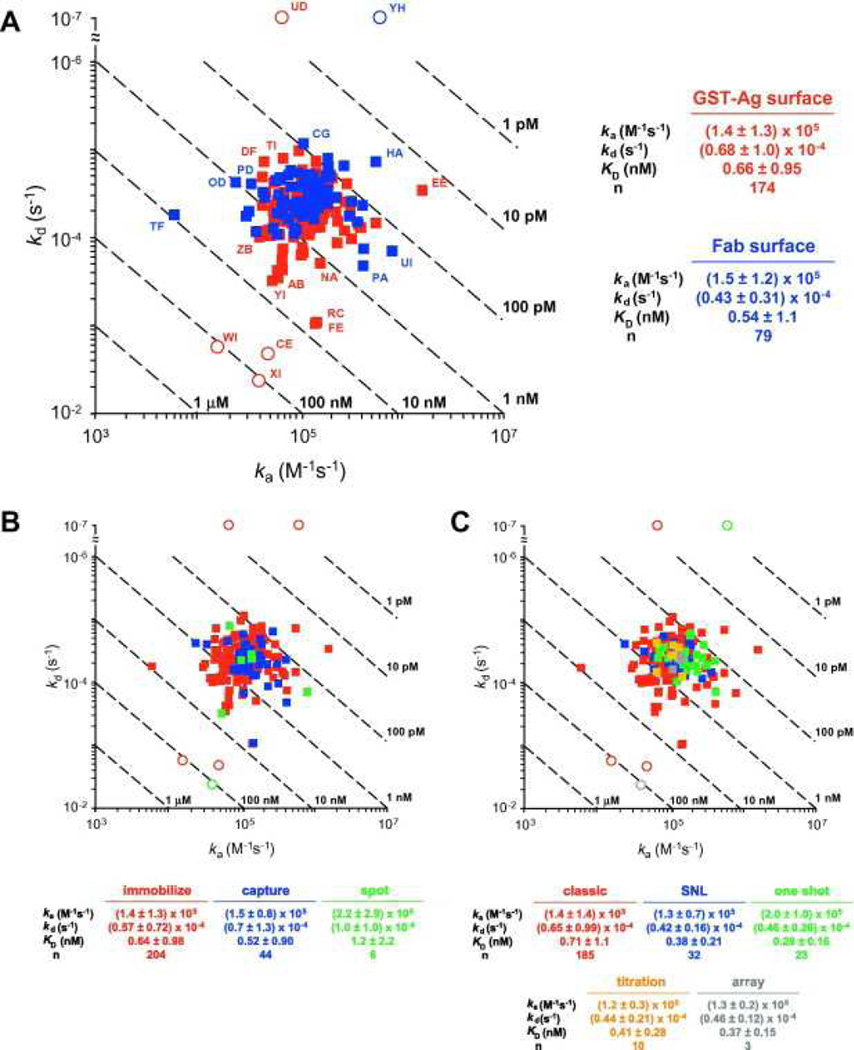
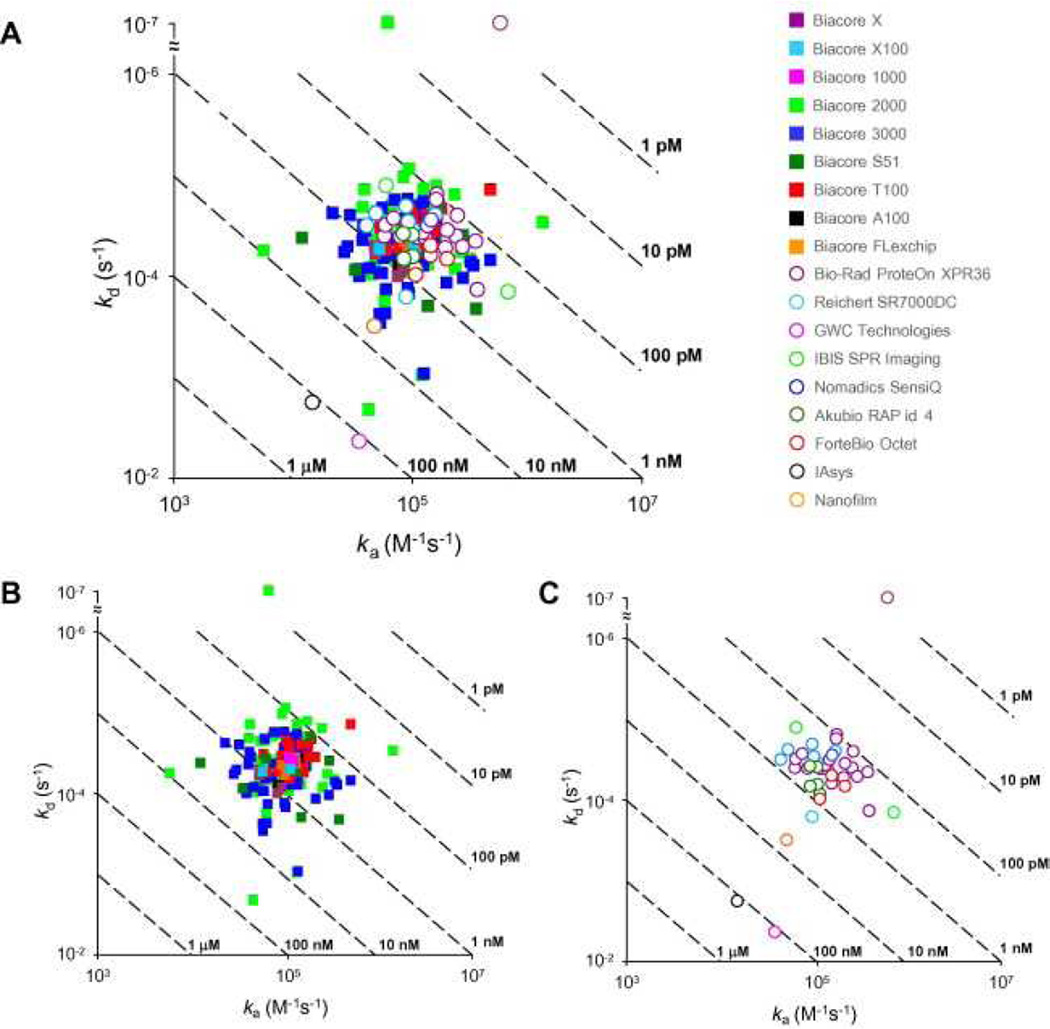
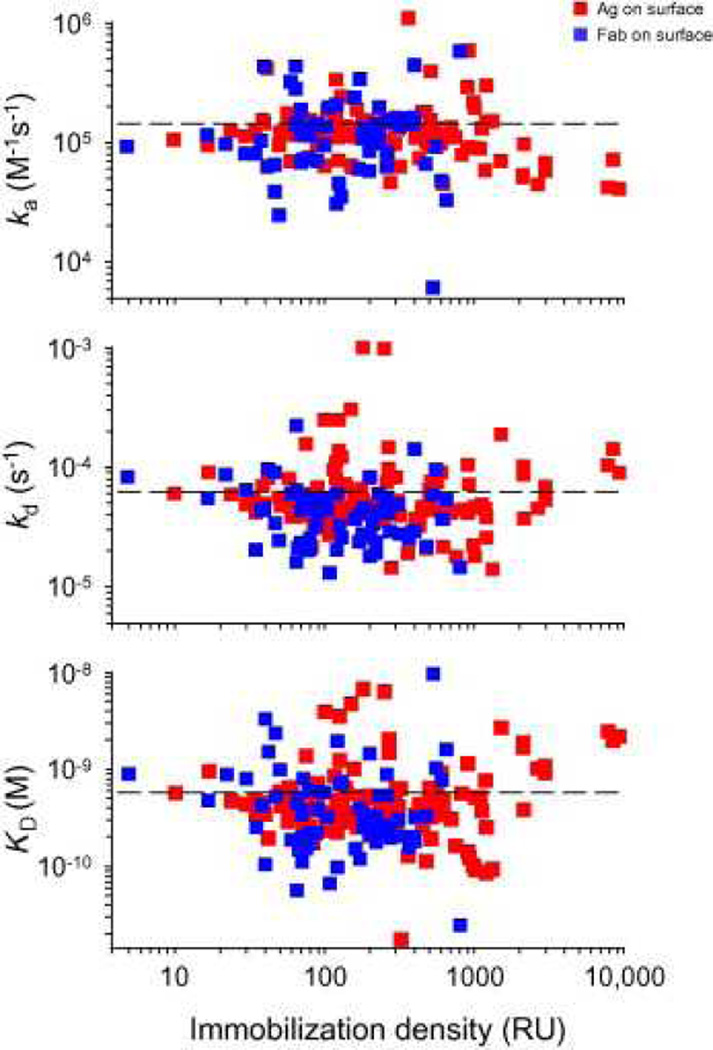
To explore the variability in biosensor studies, 150 participants from 20 countries were given the same protein samples and asked to determine kinetic rate constants for the interaction. We chose a protein system that was amenable to analysis using different biosensor platforms as well as by users of different expertise levels. The two proteins (a 50-kDa Fab and a 60-kDa glutathione S-transferase [GST] antigen) form a relatively high-affinity complex, so participants needed to optimize several experimental parameters, including ligand immobilization and regeneration conditions as well as analyte concentrations and injection/dissociation times. Although most participants collected binding responses that could be fit to yield kinetic parameters, the quality of a few data sets could have been improved by optimizing the assay design. Once these outliers were removed, the average reported affinity across the remaining panel of participants was 620 pM with a standard deviation of 980 pM. These results demonstrate that when this biosensor assay was designed and executed appropriately, the reported rate constants were consistent, and independent of which protein was immobilized and which biosensor was used.


Figures

Fig. 1
Fig. 1
Locations of, and instruments used by, the study participants.
Fig. 2
Fig. 2
Participants’ experimental parameters. (A) Instruments used, with Biacore platforms indicated in red and other manufacturers’ platforms indicated in blue. (B) Assay formats, with those requiring surface regeneration in red and other formats in blue. (C) Immobilized binding partners and tethering methods, with Ag as the ligand in red and Fab as the ligand in blue. (D) Immobilization densities for the Ag (red) and Fab (blue) from experiments performed using Biacore and Bio-Rad platforms. (The other technologies report responses in units other than resonance units [RU].) (E) Numbers of surfaces prepared. Analyses of two or more surfaces are shown in shades of blue. (F) Regeneration conditions, with nonacidic conditions shown in blue. (G) Flow rates used during analyte binding studies. (H) Highest analyte concentrations. (I) Dilution factors. (J) Lengths of analyte injection time. (For the ForteBio experiments, this corresponds to the time that the ligand-immobilized tips were immersed in analyte-containing wells.) (K) Lengths of time that the dissociation phase was monitored (dissociation was not monitored in the IAsys experiment.) In panels H–K, red bars represent parameters for Ag as the binding partner in solution and blue bars represent Fab in solution. (L) Numbers of replicates when Ag (red) and Fab (blue) were the binding partners in solution. (For interpretation of color mentioned in this figure the reader is referred to the web version of the article.)
Fig. 3
Fig. 3
Types of assay format used in the study. (A) Classic: several analyte concentrations flowed serially across an immobilized ligand with a surface regeneration step between each injection. (B) SNL (short-‘n-long) dissociation: several analyte concentrations with a relatively short dissociation phase and one analyte concentration with a much longer dissociation phase flowed serially across an immobilized ligand with a regeneration step between each injection. (C) One-shot: several analyte concentrations flowed in parallel across a ligand surface without surface regeneration. (D) Kinetic titration: several analyte concentrations flowed serially over a ligand surface without surface regeneration. (E) Ligand array: a single analyte concentration flowed simultaneously across multiple immobilized ligand spots of different densities without surface regeneration. In this nine-spot array example, the ligand was spotted three times at three concentrations. RU, resonance units.
Fig. 4
Fig. 4
Preimmobilization tests of Fab (left) and Ag (right). (A) Nonspecific binding test: the responses from injections of a buffer blank and 100 nM protein across an unmodified sensor chip are overlaid. (B) pH scouting: 100 nM protein was injected at different pH levels to identify the optimal pH for ligand preconcentration. RU, resonance units.
Fig. 5
Fig. 5
Fig. 6
Fig. 6
Data sets submitted by participants using Biacore instruments. Participants A–D used Biacore A100, participants E to KA used Biacore T100, participants LA to SA used Biacore S51, participants TA to QD used Biacore 3000, participants RD to PG used Biacore 2000, participants QG and RG used Biacore 1000, participants SG and TG used Biacore X100, participants UG to BH used Biacore X, and participants CH to FH used Biacore Flexchip. The choice of ligand immobilized (Ag or Fab) is indicated on the left. The method of tethering the ligand to the surface (immobilization, capture, or spotting) is indicated on the right. RU, resonance units.
Fig. 6
Fig. 6
Data sets submitted by participants using Biacore instruments. Participants A–D used Biacore A100, participants E to KA used Biacore T100, participants LA to SA used Biacore S51, participants TA to QD used Biacore 3000, participants RD to PG used Biacore 2000, participants QG and RG used Biacore 1000, participants SG and TG used Biacore X100, participants UG to BH used Biacore X, and participants CH to FH used Biacore Flexchip. The choice of ligand immobilized (Ag or Fab) is indicated on the left. The method of tethering the ligand to the surface (immobilization, capture, or spotting) is indicated on the right. RU, resonance units.
Fig. 7
Fig. 7
Data sets submitted by participants using the Bio-Rad ProteOn XPR36 instrument. The choice of ligand immobilized (Ag or Fab) is indicated on the left. The method of tethering the ligand to the surface (immobilization or capture) is indicated on the right. RU, resonance units.
Fig. 7
Fig. 7
Data sets submitted by participants using the Bio-Rad ProteOn XPR36 instrument. The choice of ligand immobilized (Ag or Fab) is indicated on the left. The method of tethering the ligand to the surface (immobilization or capture) is indicated on the right. RU, resonance units.
Fig. 8
Fig. 8
Data sets submitted by participants using other manufacturers’ instruments. The choice of ligand immobilized (Ag or Fab) is indicated on the left. The method of tethering the ligand to the surface (immobilization, capture, or spotting) is indicated on the right. RU, resonance units.
Fig. 9
Fig. 9
kd versus ka plots of the kinetic parameters determined by the participants. Dashed diagonals depict isoaffinity lines. Circles indicate the five data sets omitted from the statistical analysis. (A) Analyses of Ag surfaces are shown in red, and Fab surfaces are shown in blue. Data sets peripheral to the central cluster are noted by participant assignment. (B) Analyses grouped by ligand tethering method. (C) Analyses grouped by assay design. In each panel, the average and standard deviation for each group are listed below the plot. (For interpretation of color mentioned in this figure the reader is referred to the web version of the article.)
Fig. 10
Fig. 10
kd versus ka plots grouped by biosensor platform. (A) Kinetics obtained from all instrument types. (B) Kinetics obtained from the various Biacore platforms. (C) Kinetics obtained from instruments produced by other manufacturers. Dashed diagonals depict isoaffinity lines. The average and standard deviation for each group are listed in Table 1.
Fig. 11
Fig. 11
Kinetic parameters plotted against immobilization density. Ag surfaces are indicated in red, and Fab surfaces are indicated in blue. In each panel, the dashed line indicates the average determined value. RU, resonance units. (For interpretation of color mentioned in this figure the reader is referred to the web version of the article.)

References

    1. Rich RL, Myszka DG. Survey of the year 2005 commercial optical biosensor literature. J. Mol. Recognit. 2006;19:478–534. - PubMed
    1. Rich RL, Myszka DG. Survey of the year 2006 commercial optical biosensor literature. J. Mol. Recognit. 2007;20:300–366. - PubMed
    1. Rich RL, Myszka DG. Survey of the year 2007 commercial optical biosensor literature. J. Mol. Recognit. 2008;21:355–400. - PubMed
    1. Day YSN, Baird CL, Rich RL, Myszka DG. Direct comparison of equilibrium, thermodynamic, and kinetic rate constants determined by surface- and solution-based biophysical methods. Prot. Sci. 2002;11:1017–1025. - PMC - PubMed
    1. Myszka DG, Abdiche YN, Arisaka F, Byron O, Eisenstein E, Hensley P, Thomson JA, Lombardo CR, Schwarz F, Stafford W, Doyle ML. The ABRF–MIRG’02 Study: assembly state, thermodynamic, and kinetic analysis of an enzyme/inhibitor interaction. J. Biomol. Tech. 2003;14:247–269. - PMC - PubMed

Publication types