

Age-period-cohort modelling of alcohol volume and heavy drinking days in the US National Alcohol Surveys: divergence in younger and older adult trends
- PMID: 19133886
- PMCID: PMC2728753
- DOI: 10.1111/j.1360-0443.2008.02391.x
Age-period-cohort modelling of alcohol volume and heavy drinking days in the US National Alcohol Surveys: divergence in younger and older adult trends
Abstract
Aims: The decomposition of trends in alcohol volume and heavy drinking days into age, period, cohort and demographic effects offers an important perspective on the dynamics of change in alcohol use patterns in the United States.
Design: The present study utilizes data from six National Alcohol Surveys conducted over the 26-year period between 1979 and 2005. Setting United States.
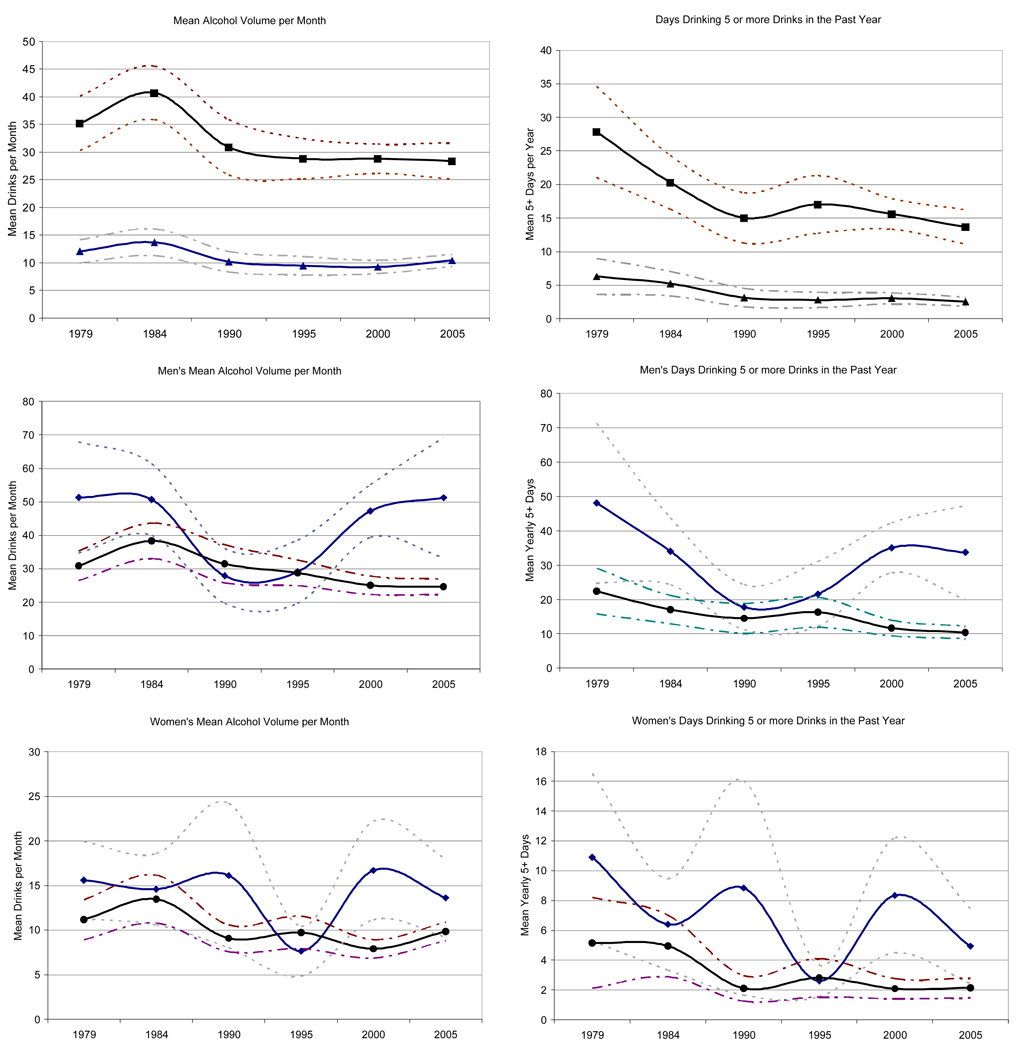
Measurements: Alcohol volume and the number of days when five or more and eight or more drinks were consumed were derived from overall and beverage-specific graduated frequency questions.
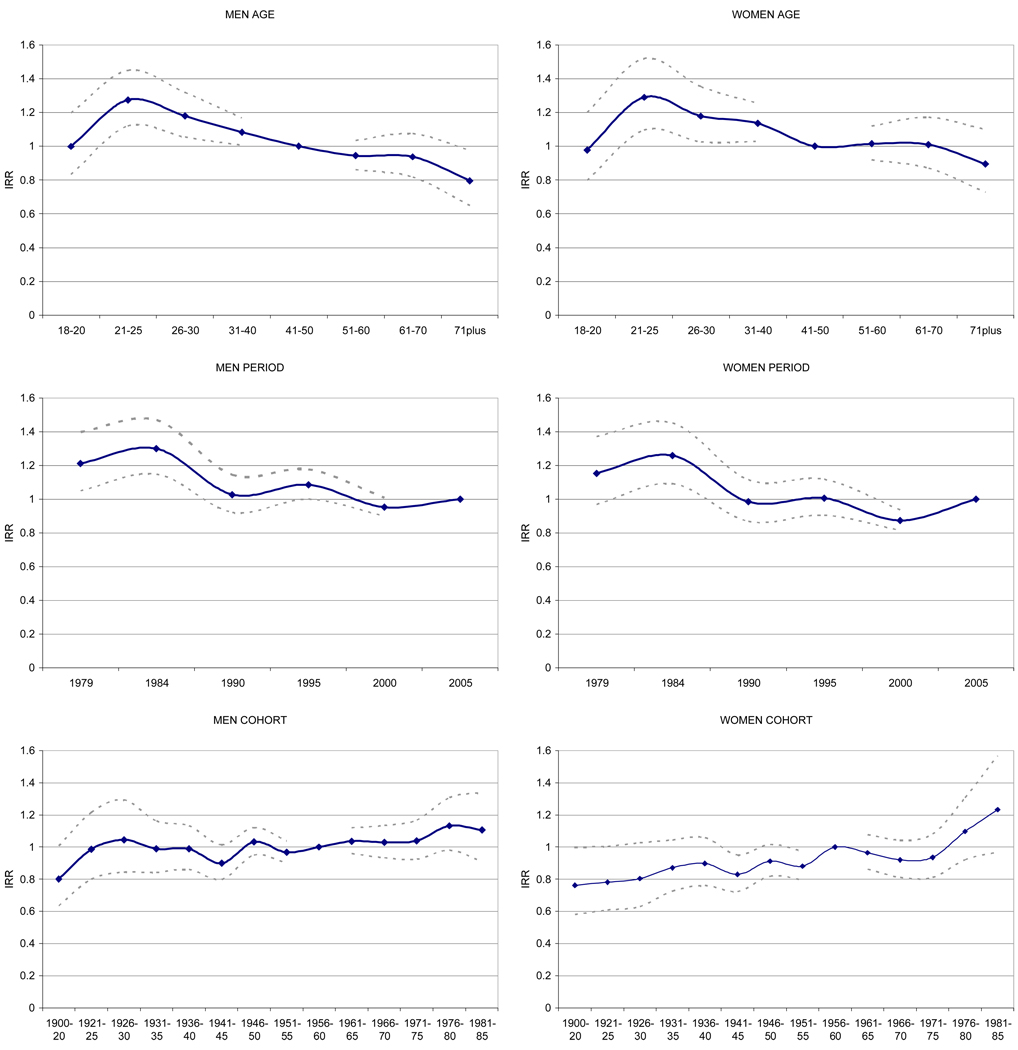
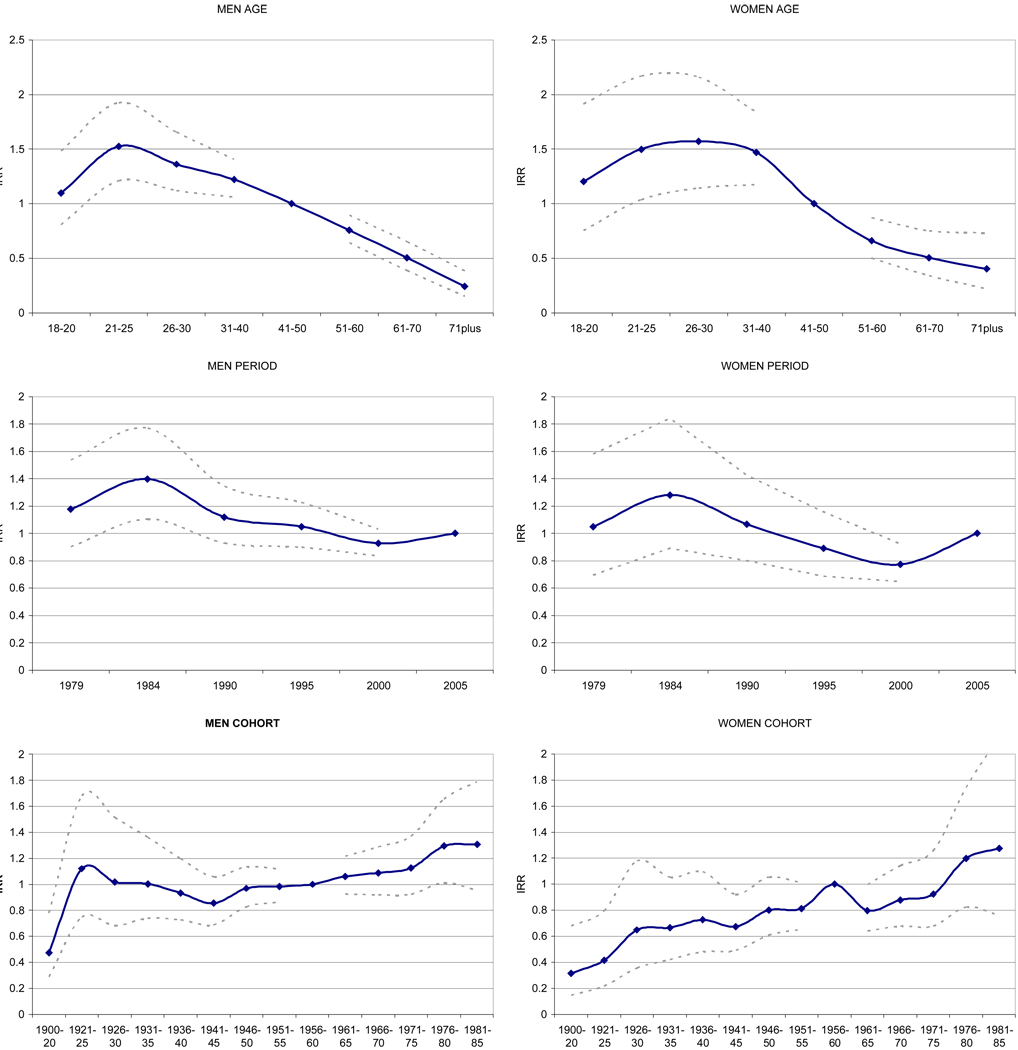
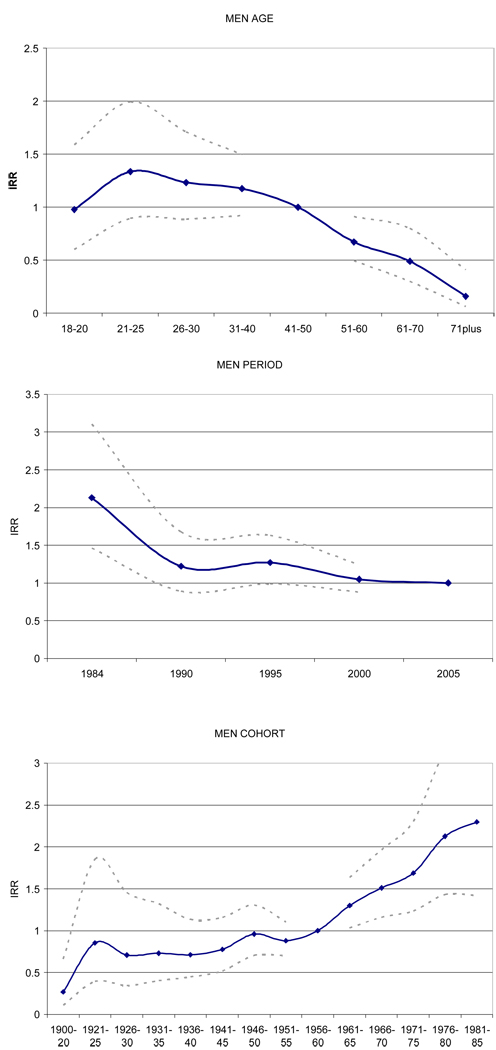
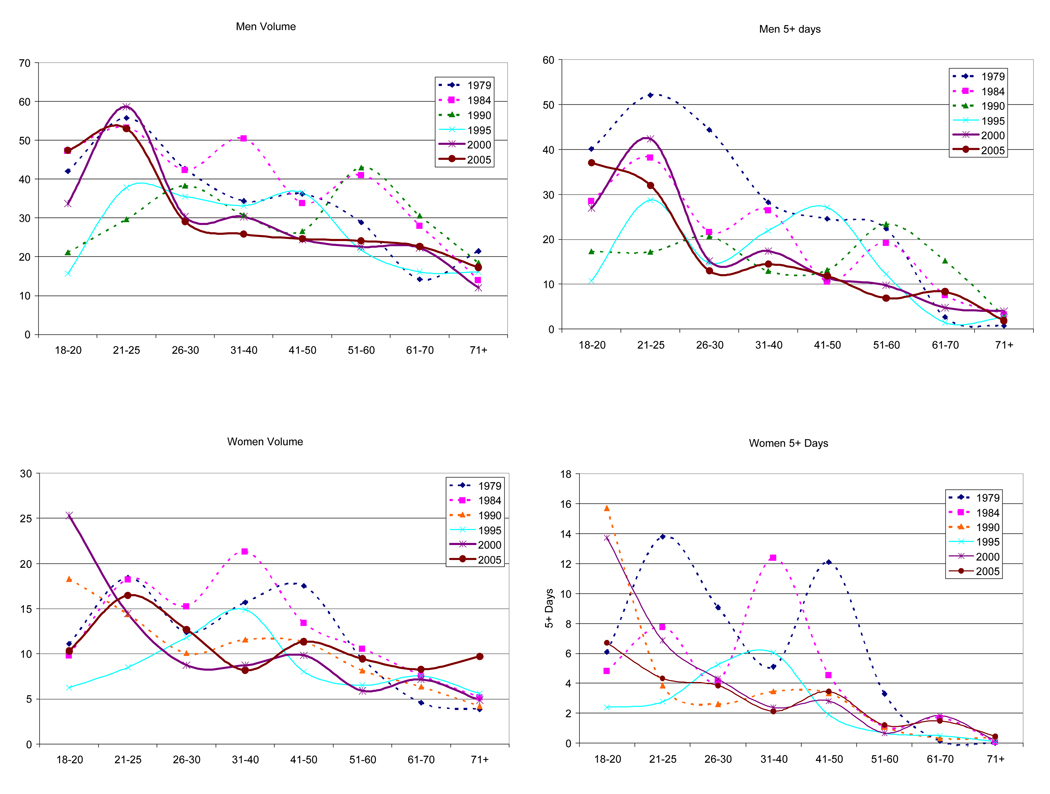
Results: Trend analyses show that while mean values of drinking measures have continued to decline for those aged 26 and older, there has been a substantial increase in both alcohol volume and 5+ days among those aged 18-25 years. Age-period-cohort models indicate a potential positive cohort effect among those born after 1975. However, an alternative interpretation of an age-cohort interaction where drinking falls off more steeply in the late 20s than was the case in the oldest surveys cannot be ruled out. For women only, the 1956-60 birth cohort appears to drink more heavily than those born just before or after. Models also indicate the importance of income, ethnicity, education and marital status in determining these alcohol measures.
Conclusions: Increased heavy drinking among young adults in recent surveys presents a significant challenge for alcohol policy and may indicate a sustained increase in future US alcohol consumption.
Figures
Similar articles
-
Are the 1976-1985 birth cohorts heavier drinkers? Age-period-cohort analyses of the National Alcohol Surveys 1979-2010.Addiction. 2013 Jun;108(6):1038-48. doi: 10.1111/j.1360-0443.2012.04055.x. Epub 2012 Oct 18. Addiction. 2013. PMID: 22897662 Free PMC article.
-
Relationships between US state alcohol policies and alcohol outcomes: differences by gender and race/ethnicity.Addiction. 2020 Jul;115(7):1285-1294. doi: 10.1111/add.14937. Epub 2020 Feb 5. Addiction. 2020. PMID: 32026511 Free PMC article.
-
U.S. trends in light, moderate, and heavy drinking episodes from 2000 to 2010.Alcohol Clin Exp Res. 2014 Sep;38(9):2496-501. doi: 10.1111/acer.12521. Alcohol Clin Exp Res. 2014. PMID: 25257297 Free PMC article.
-
Alcohol: taking a population perspective.Nat Rev Gastroenterol Hepatol. 2016 Jul;13(7):426-34. doi: 10.1038/nrgastro.2016.70. Epub 2016 May 18. Nat Rev Gastroenterol Hepatol. 2016. PMID: 27188823 Review.
-
Is burden of disease differentially linked to spirits? A systematic scoping review and implications for alcohol policy.Alcohol. 2020 Feb;82:1-10. doi: 10.1016/j.alcohol.2019.06.005. Epub 2019 Jun 29. Alcohol. 2020. PMID: 31260796
Cited by
-
Age, Period, and Cohort Effects in Alcohol Use in the United States in the 20th and 21st Centuries: Implications for the Coming Decades.Alcohol Res. 2022 Jan 13;42(1):02. doi: 10.35946/arcr.v42.1.02. eCollection 2022. Alcohol Res. 2022. PMID: 35083099 Free PMC article.
-
A Population-Based Study of Alcohol Use in Same-Sex and Different-Sex Unions.J Marriage Fam. 2014 Jun 1;76(3):557-572. doi: 10.1111/jomf.12113. J Marriage Fam. 2014. PMID: 24860195 Free PMC article.
-
Test-retest reliability and validity of life-course alcohol consumption measures: the 2005 National Alcohol Survey follow-up.Alcohol Clin Exp Res. 2014 Sep;38(9):2479-87. doi: 10.1111/acer.12480. Epub 2014 Jul 28. Alcohol Clin Exp Res. 2014. PMID: 25070623 Free PMC article.
-
Health behaviour and its determinants in elderly patients with chronic diseases: evidence from Jiangsu Province, China.BMC Geriatr. 2022 Apr 7;22(1):297. doi: 10.1186/s12877-022-03010-w. BMC Geriatr. 2022. PMID: 35392819 Free PMC article.
-
Potential side effects of unhealthy lifestyle choices and health risks on basal and reactive heart rate variability in college drinkers.J Stud Alcohol Drugs. 2013 Sep;74(5):787-96. doi: 10.15288/jsad.2013.74.787. J Stud Alcohol Drugs. 2013. PMID: 23948539 Free PMC article.
References
-
- Rehm J, Room R, Graham K, Monteiro M, Gmel G, Sempos CT. The relationship of average volume of alcohol consumption and patterns of drinking to burden of disease — an overview. Addiction. 2003;98:1209–1228. - PubMed
-
- Kerr WC, Greenfield TK, Tujague J. Estimates of the mean alcohol concentration of the spirits, wine, and beer sold in the U.S. and per capita consumption: 1950–2002. Alcoholism: Clinical & Experimental Research. 2006;30:1583–1591. - PubMed
-
- Beer Institute. Brewers Almanac. Washington, DC: Beer Institute; 2007.
-
- Kerr WC, Greenfield TK, Bond J, Ye Y, Rehm J. Age, period and cohort influences on beer, wine and spirits consumption trends in the US National Surveys. Addiction. 2004;99:1111–1120. - PubMed
Publication types
MeSH terms
Substances
Grants and funding
LinkOut - more resources
Full Text Sources
Medical
