. 2009 Jan;96(1):199-208.
doi: 10.1016/j.bpj.2008.10.002.

Multistep aggregation pathway of human interleukin-1 receptor antagonist: kinetic, structural, and morphological characterization

Affiliations

Multistep aggregation pathway of human interleukin-1 receptor antagonist: kinetic, structural, and morphological characterization

Sampathkumar Krishnan et al. Biophys J. 2009 Jan.

Abstract

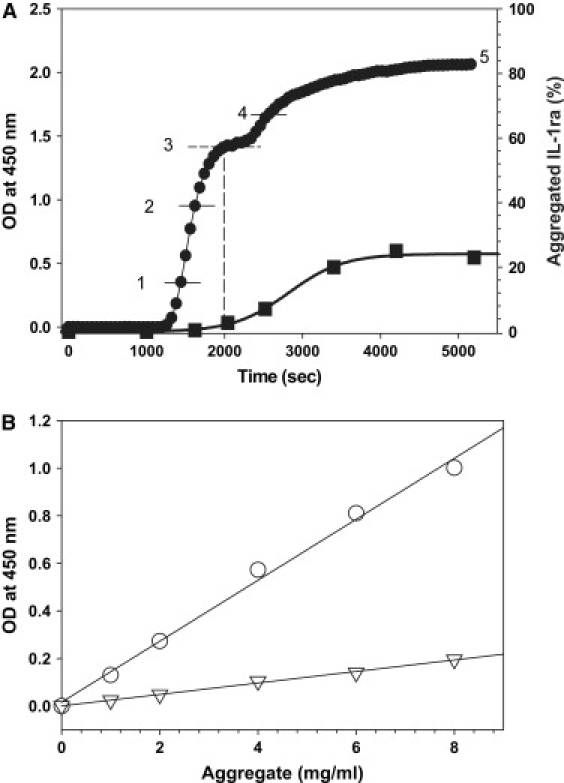
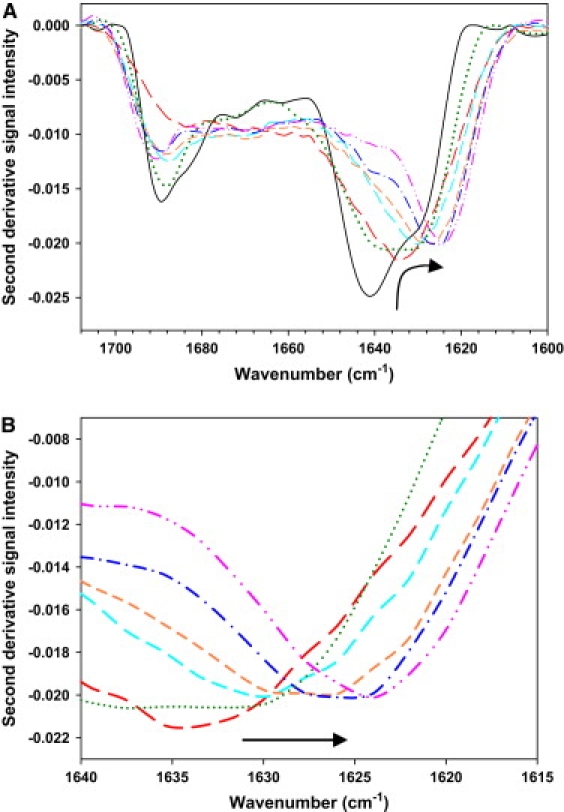
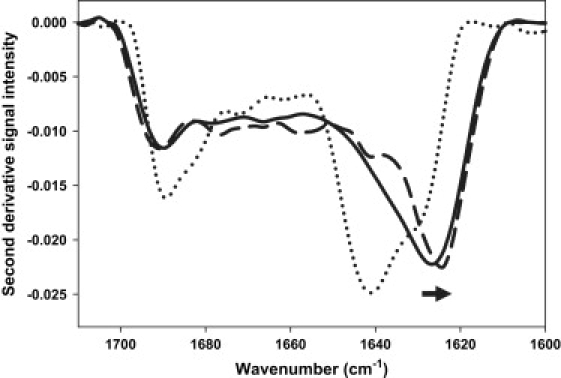
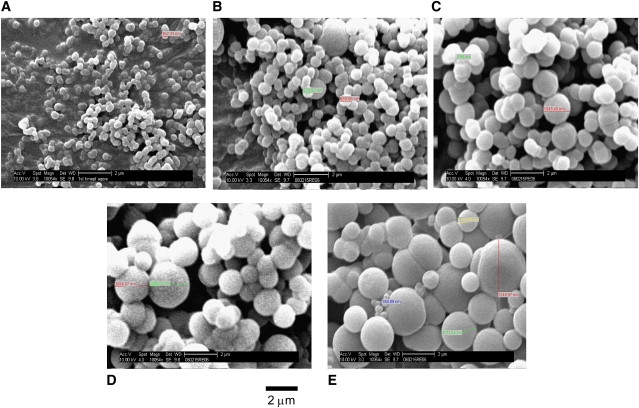
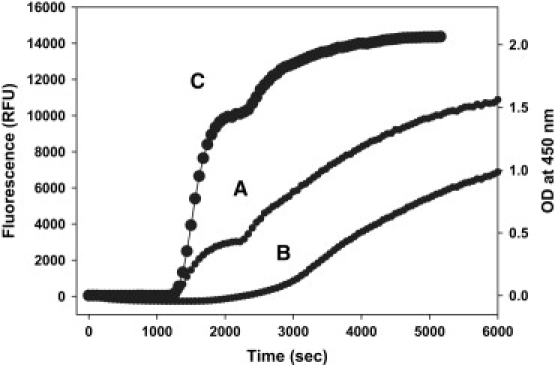
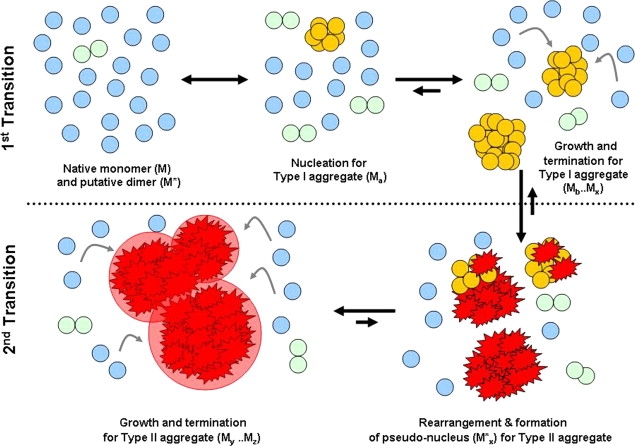
The complex, multistep aggregation kinetic and structural behavior of human recombinant interleukin-1 receptor antagonist (IL-1ra) was revealed and characterized by spectral probes and techniques. At a certain range of protein concentration (12-27 mg/mL) and temperature (44-48 degrees C), two sequential aggregation kinetic transitions emerge, where the second transition is preceded by a lag phase and is associated with the main portion of the aggregated protein. Each kinetic transition is linked to a different type of aggregate population, referred to as type I and type II. The aggregate populations, isolated at a series of time points and analyzed by Fourier-transform infrared spectroscopy, show consecutive protein structural changes, from intramolecular (type I) to intermolecular (type II) beta-sheet formation. The early type I protein spectral change resembles that seen for IL-1ra in the crystalline state. Moreover, Fourier-transform infrared data demonstrate that type I protein assembly alone can undergo a structural rearrangement and, consequently, convert to the type II aggregate. The aggregated protein structural changes are accompanied by the aggregate morphological changes, leading to a well-defined population of interacting spheres, as detected by scanning electron microscopy. A nucleation-driven IL-1ra aggregation pathway is proposed, and assumes two major activation energy barriers, where the second barrier is associated with the type I --> type II aggregate structural rearrangement that, in turn, serves as a pseudonucleus triggering the second kinetic event.


Figures

Figure 1
Figure 1
Aggregation of 22 mg/mL IL-1ra in CSE buffer, pH 6.5, at 47°C. (A) Aggregation kinetic profile (solid circles) and corresponding estimates of aggregated protein (solid squares), as described in detail in Materials and Methods. Five different time points from which aggregates were collected for further analyses are indicated on kinetic plot. (B) Relationship between OD450 and amount of suspended aggregate. Plots are shown for isolated aggregate populations associated with first (type I, open circles) and second (type II, open triangles) kinetic transitions.
Figure 2
Figure 2
Second derivative FTIR spectra show protein structural changes in IL-1ra aggregates isolated at time points indicated in Fig. 1. Direction of spectral change is indicated by arrow. (A) Control native protein in solution (solid black line), followed by aggregates at first (long red dashed line), second (medium cyan dashed line), third (short orange dashed line), fourth (blue dotted and dashed line), and fifth (pink double dotted and dashed line) time points. Also shown are FTIR data of protein in crystalline state (green dotted line). (B) Detailed view of overlaid FTIR spectra demonstrates how type I aggregates (time points 1–3) undergo a consecutive structural transition and display more of the intramolecular β-sheet structure at 1638–1628 cm−1, which is converted into intermolecular β-sheet at 1622 cm−1 and 1695 cm−1, as seen in type II aggregates (time points 4–5).
Figure 3
Figure 3
IL-1ra second derivative FTIR spectra show protein structural changes within isolated type I aggregates after incubation at 47°C. Overlaid type I protein-aggregate spectra before (solid line) and after (dashed line) incubation are shown. Reference spectrum of native protein in solution is also indicated (dotted line). Aggregated protein alone is capable of type I → type II structural rearrangement, as indicated by arrow.
Figure 4
Figure 4
Scanning electron micrographs show morphology of IL-1ra aggregates collected at time points 1–5 (AE). Magnification, ×10,000. (A and B) Time points 1 and 2 represent type I transition, and show average growth of aggregates from 0.5 to 1.0 μm diameter. (D and E) Time points 4 and 5 represent type II transition, and demonstrate further aggregate growth up to 3.3-μm diameter. (C) Time point 3, with 1–1.5-μm diameter aggregates, represents midpoint between transitions. A 2-μm scale bar is shown below D. See Results for more details.
Figure 5
Figure 5
Dye-tracer aggregation kinetic profiles of 22 mg/mL IL-1ra in CSE at 47°C, as monitored by bis-ANS (curve A) and thioflavin T (curve B) fluorescence. Ex = 420 nm, and Em = 500 nm (see Materials and Methods for details). The OD450 trace (curve C) from Fig. 1 is shown as a reference.
Figure 6
Figure 6
Effect of temperature and protein concentration on IL-1ra aggregation rates. IL-1ra is in CSE buffer, pH 6.5. (A) Observed aggregation rates (ν, unit/h) for first (circles) and second (triangles) transitions of aggregation are plotted against temperature (K). Protein concentration is 27 mg/mL. Error bar represents standard deviation of seven samples. (B) The ln-ln plot of ν (unit/h) versus protein molar concentration. Temperature is 47°C. First (circles) and second (triangles) kinetic transition data are plotted and linearly fitted, showing slope values of 1.67 and 1.06, respectively. Error bar represents standard deviation of three samples. Dotted lines represent 95% confidence intervals for slopes. See Materials and Methods for experimental details.
Figure 7
Figure 7
Schematic drawing of proposed IL-1ra aggregation pathway at elevated temperatures. Monomer (M) and dimer (M) are blue single and green double circles, respectively. Both nucleus (Ma) and type I aggregates (Mb … Mx) are clusters of yellow circles. The rearrangement of type I aggregates into a pseudonucleus (Mx) is indicated by red asterisk clusters. Type II aggregates (My … Mz) are asterisk-filled red circles. See Discussion for more details.
Figure 8
Figure 8
Crystal structure-based IL-1ra surface analysis suggests an exposed β-sheet with a hydrophobic channel. The surface distribution was analyzed using a 3D Molecule Viewer (Invitrogen, Carlsbad, CA) and the Protein Data Bank coordinate file 1ILR. The β-sheet is shown in red (right). The putative hydrophobic channel is contributed by residues W17, F149, F14, V49, L57, P51, and I52 (left). Residue number accounts for the presence of an extra N-terminal methionine in the recombinant protein.

Similar articles

Cited by

References

    1. Cleland J.F., Powell M.F., Shire S.J. The development of stable protein formulations: a close look at protein aggregation, deamidation, and oxidation. Crit. Rev. Ther. Drug Carrier Syst. 1993;10:307–377. - PubMed
    1. Carpenter J.F., Kendrick B.S., Chang B.S., Manning M.C., Randolph T.W. Inhibition of stress-induced aggregation of protein therapeutics. Methods Enzymol. 1999;309:236–255. - PubMed
    1. Fink A.L. Protein aggregation: folding aggregates, inclusion bodies and amyloid. Fold. Des. 1998;3:R9–R23. - PubMed
    1. Manning M.C., Patel K., Borchardt R.T. Stability of protein pharmaceuticals. Pharm. Res. 1989;6:903–918. - PubMed
    1. Koo E.H., Lansbury P.T., Kelly J.W. Amyloid diseases: abnormal protein aggregation in neurodegeneration. Proc. Natl. Acad. Sci. USA. 1999;96:9989–9990. - PMC - PubMed

Substances

LinkOut - more resources