. 2009 Jan 9;136(1):149-62.
doi: 10.1016/j.cell.2008.12.001.

Variant ionotropic glutamate receptors as chemosensory receptors in Drosophila

Affiliations

Variant ionotropic glutamate receptors as chemosensory receptors in Drosophila

Richard Benton et al. Cell. .

Abstract

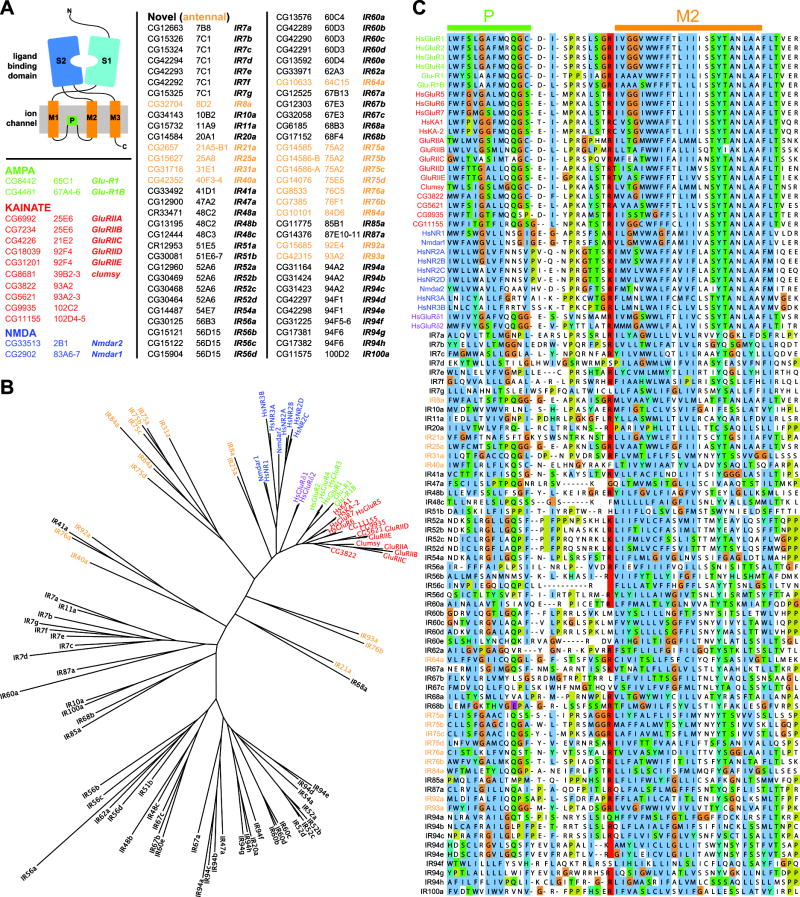
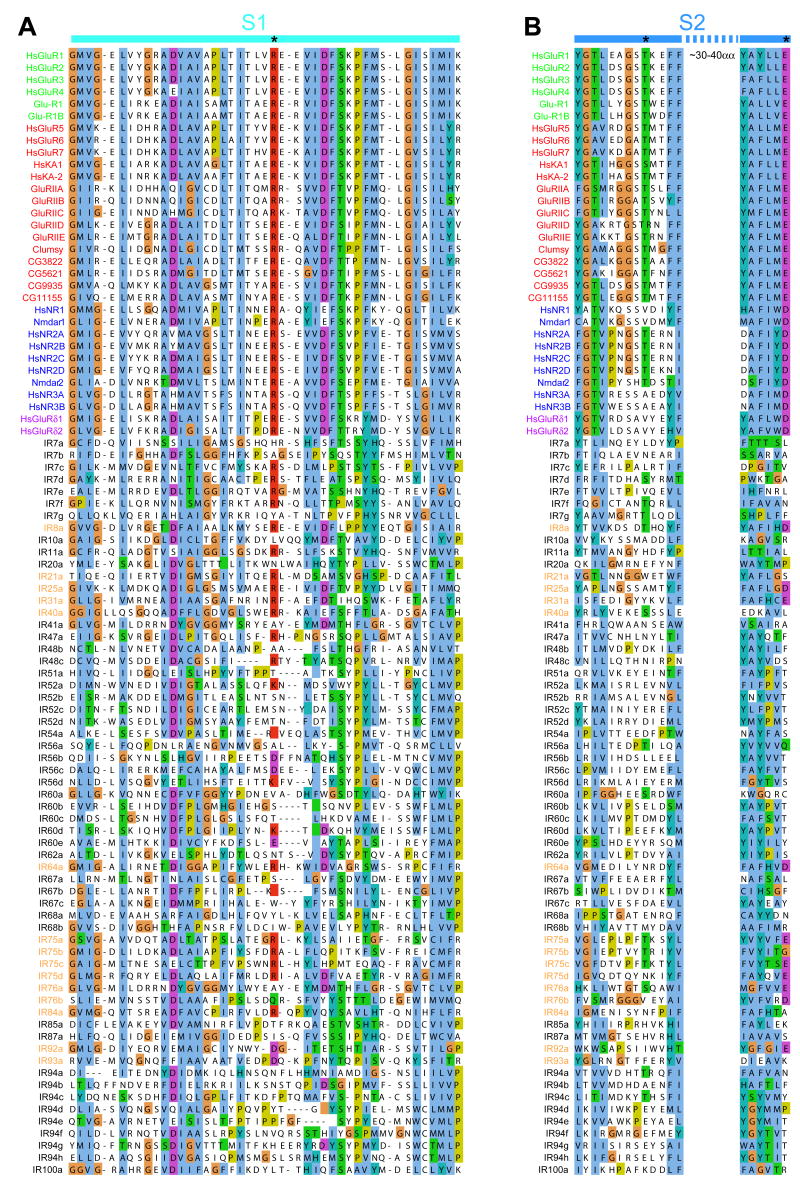
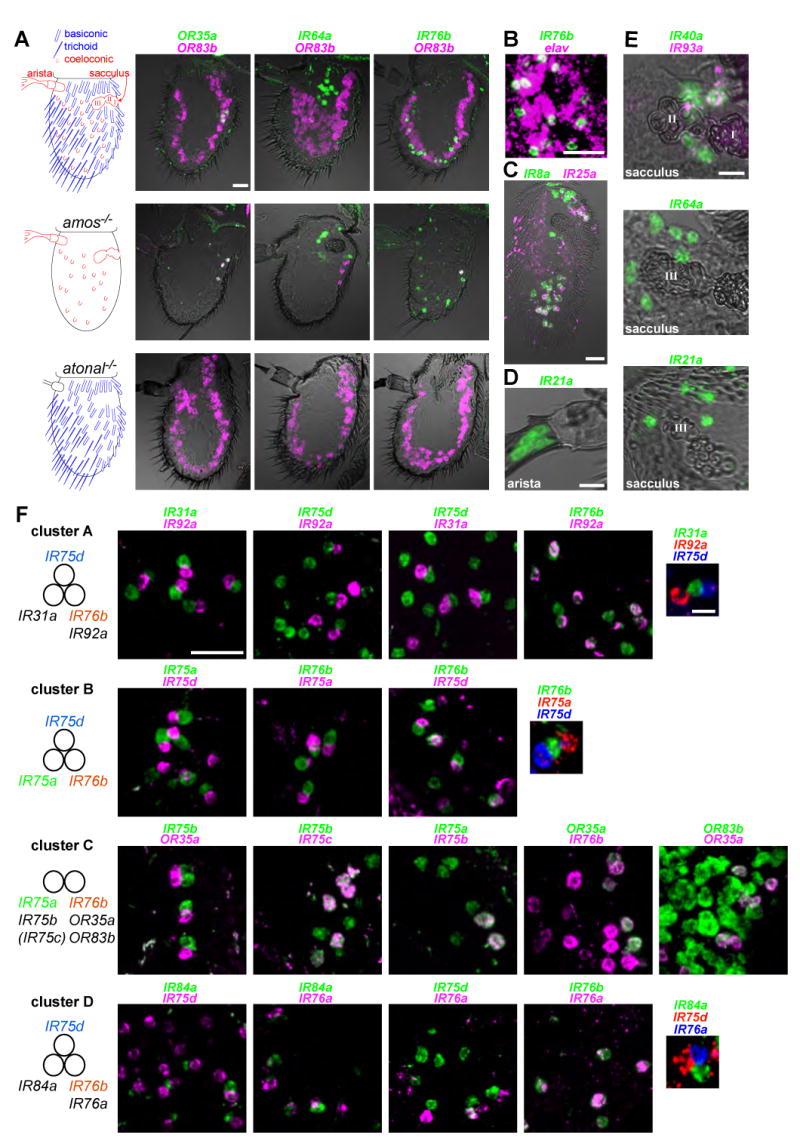
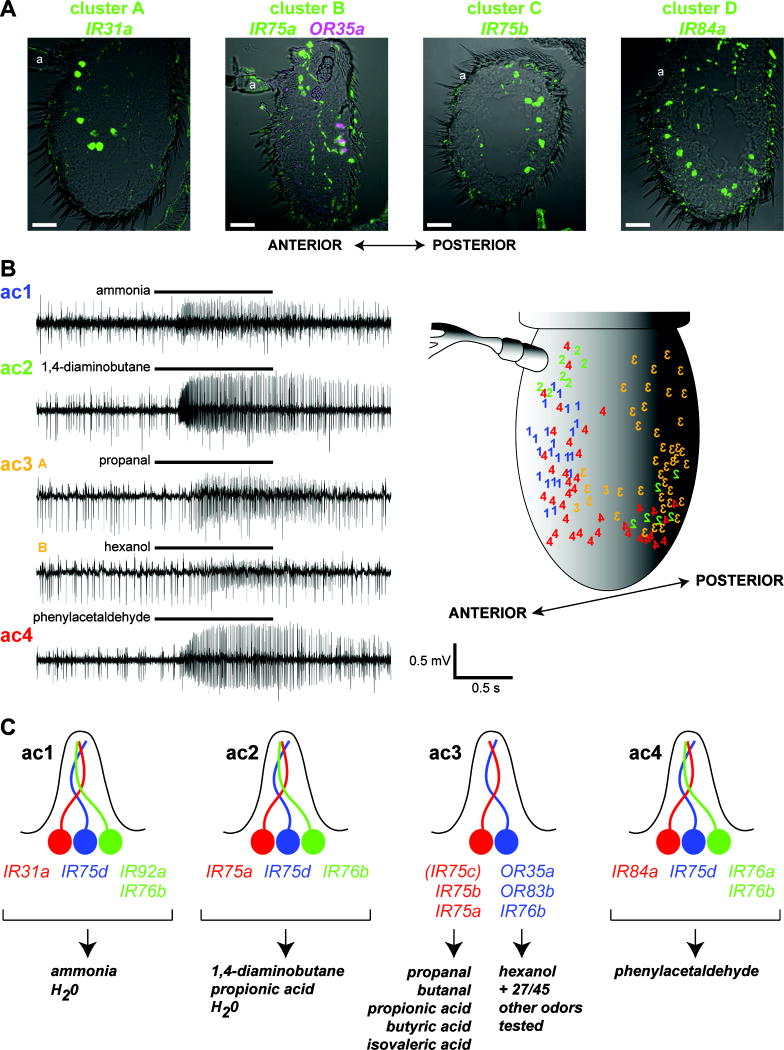
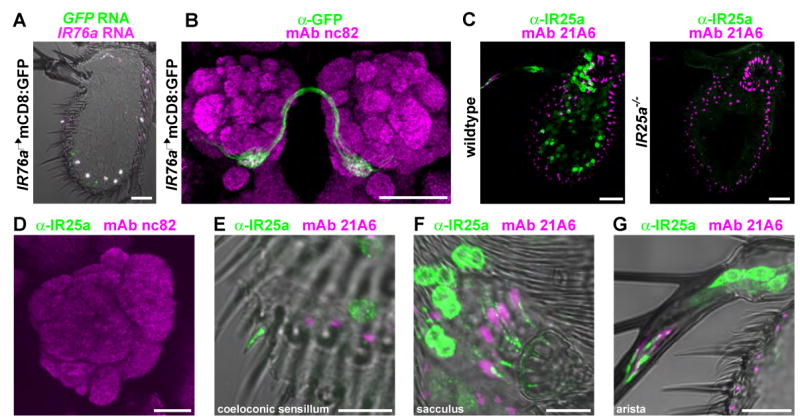
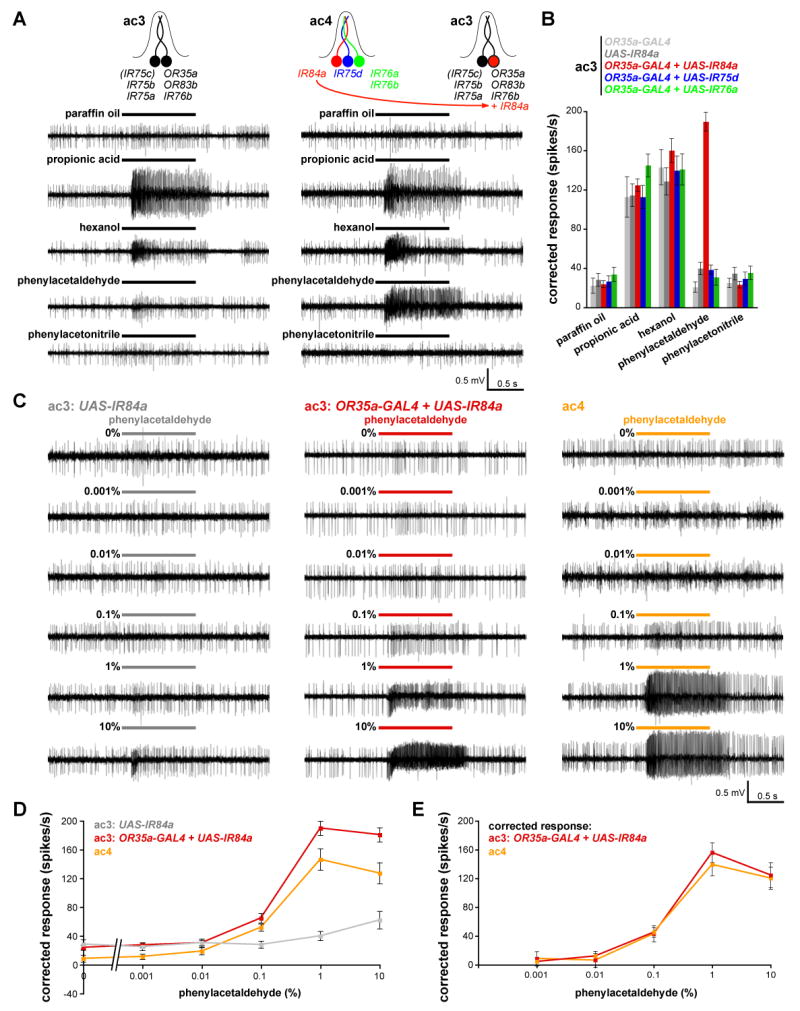
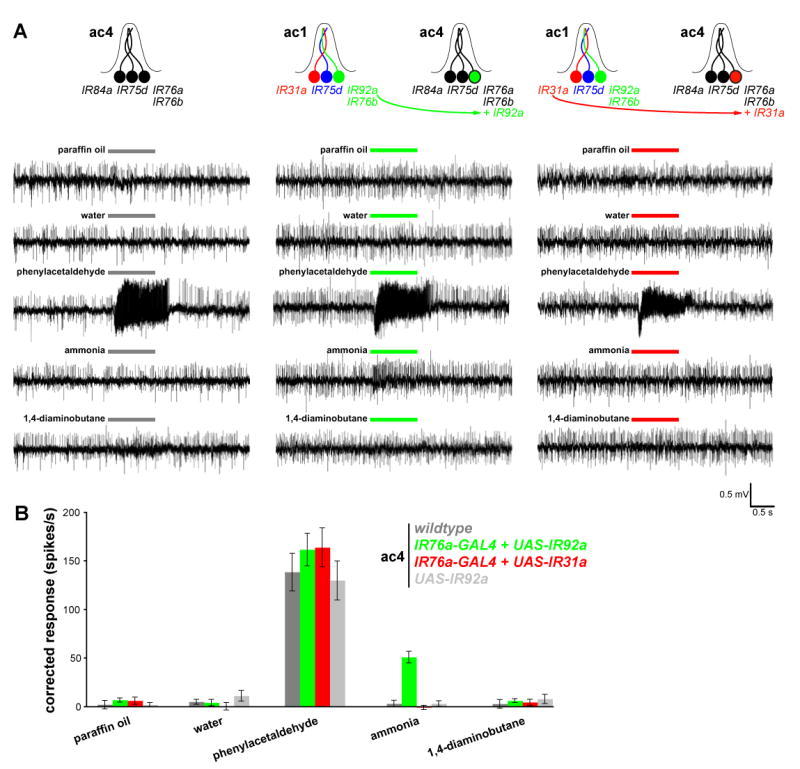
Ionotropic glutamate receptors (iGluRs) mediate neuronal communication at synapses throughout vertebrate and invertebrate nervous systems. We have characterized a family of iGluR-related genes in Drosophila, which we name ionotropic receptors (IRs). These receptors do not belong to the well-described kainate, AMPA, or NMDA classes of iGluRs, and they have divergent ligand-binding domains that lack their characteristic glutamate-interacting residues. IRs are expressed in a combinatorial fashion in sensory neurons that respond to many distinct odors but do not express either insect odorant receptors (ORs) or gustatory receptors (GRs). IR proteins accumulate in sensory dendrites and not at synapses. Misexpression of IRs in different olfactory neurons is sufficient to confer ectopic odor responsiveness. Together, these results lead us to propose that the IRs comprise a novel family of chemosensory receptors. Conservation of IR/iGluR-related proteins in bacteria, plants, and animals suggests that this receptor family represents an evolutionarily ancient mechanism for sensing both internal and external chemical cues.


Conflict of interest statement

The authors declare no conflict of interest.

Figures

Figure 1
Figure 1. A novel family of divergent ionotropic glutamate receptors in Drosophila
(A) Top left: model of iGluR domain organization. Bottom left and right: table of Drosophila iGluRs and IRs, with corresponding cytological location and gene names. (B) Phylogenetic tree of Drosophila and human iGluRs and Drosophila IRs, color-coded as in (A). (C) Alignments of the amino acid sequences of Drosophila and human iGluRs and Drosophila IRs of part of the pore loop, P, and M2 transmembrane segment of the ion channel domain.
Figure 2
Figure 2. Ligand binding domains in most IRs lack glutamate-interacting residues
(A-B) ClustalW amino acid alignments of part of the S1 (A) and S2 (B) ligand binding domains of Drosophila and human iGluRs and Drosophila IRs. The positions of key ligand binding residues in iGluRs are marked with asterisks at the top.
Figure 3
Figure 3. A topological map of IR expression in the antenna
(A) Left: cartoons of the Drosophila antenna, in which sensory structures are color-coded by their developmental specification by the proneural genes amos (blue) or atonal (red). Right: two-color RNA in situ hybridization for OR83b (magenta) and either OR35a (green, left), IR64a (green, middle) or IR76b (green, right) on antennal sections of wildtype (top), amos mutant (amos1/Df(2L)M36F-S6) (middle) and atonal mutant (ato1/Df(3R)p13) (bottom) animals. Scale bar for all panels is 20 μm. (B) Two-color RNA in situ hybridization for IR76b (green) and the neuronal marker elav (magenta) on an antennal section of a wildtype antenna. Scale bar is 20 μm. (C) Two-color RNA in situ hybridization on an antennal section for IR8a (green) and IR25a (magenta). Scale bar is 20 μm. (D) One-color RNA in situ hybridization on antennal sections reveals expression of IR21a in the arista. (E) One- and two-color RNA in situ hybridization on antennal sections reveals co-expression of IR40a (green) and IR93a (magenta) in neurons surrounding the first and second chamber of the sacculus (top) and expression of IR64a (middle) and IR21a (bottom) in neurons surrounding the third chamber of the sacculus. Scale bars are 10 μm. (F) Two- and three-color RNA in situ hybridization for the indicated combinations of IR genes expressed in neurons in the main portion of the antenna. Pairwise comparison of physically adjacent neurons allows the definition of four distinct clusters (A-D) of IR-expressing neurons, summarized in the schemes on the left. IR genes expressed in more than one cluster are highlighted in color. The parentheses around IR75c refer to the expression of this gene in only a subset of cluster C (111 IR75c-expressing cells/155 IR75b-expressing cells =71.6%). Scale bar for all two-color panels is 20 μm, and for all three-color panels is 5 μm.
Figure 4
Figure 4. Integration of molecular and functional maps in the coeloconic sensilla
(A) RNA in situ hybridization on antennal sections of wildtype animals for the indicated IR genes representing each of the 4 clusters. Cluster B is represented by IR75a-expressing OSNs (green) that are not paired with OR35a-expressing neurons (magenta). “a” indicates the position of the arista, which projects from the anterior surface of the antenna. Anterior is to the left in all images. Scale bars are 20 μm. (B) Left: representative traces of extracellular recordings of each coeloconic sensillum class, stimulated with diagnostic odorants (Yao et al., 2005) as indicated. Bars above the traces mark stimulus time (1 s). For ac3, two diagnostic odorants are shown, which specifically stimulate the A (large spike amplitude) or B (small spike amplitude) neuron. Right: Schematic of the topological distribution of ac1-ac4 coeloconic sensillum classes mapped manually after electrophysiological recordings from both the anterior and posterior surfaces of the antenna. Sensilla types are indicated as 1-4, with numbers reversed for sensilla on the posterior face of the antenna. (C) Summary of the predicted molecular identity of IR-expressing neurons and sensilla classes they innervate. Best ligands (producing a response of >45 spikes/s) for each class are shown as the bottom, from a limited screen of a panel of 45 odors (Yao et al., 2005). All identified ligands of the ac3 OR35a/OR83b/IR76b neuron have been shown to be genetically dependent on OR35a (Yao et al., 2005).
Figure 5
Figure 5. Glomerular convergence of IR axons and ciliary localization of IR proteins
(A) Two-color RNA in situ hybridization for GFP (green) and IR76a (magenta) on an antennal section of an animal expressing the mCD8:GFP reporter under the control of the IR76a promoter-GAL4 driver (IR76a promoter-GAL4/UAS-mCD8:GFP). Scale bar is 20 μm. (B) Immunostaining of mCD8:GFP-labelled IR76a axon termini (anti-GFP, green) and neuropil (mAb nc82, magenta) on whole-mount brains of IR76a promoter-GAL4/UAS-mCD8:GFP animals. Scale bar is 50 μm. (C) Immunostaining for IR25a (green) and a cilia base marker (mAb 21A6, magenta) in antennal sections from wildtype (left) and IR25a null mutant (IR25a1/IR25a2) animals. Scale bars are 20 μm. (D) Immunostaining of IR25a (green) and neuropil (mAb nc82, magenta) in the antennal lobe of a wildtype animal. Scale bar is 20 μm. (E-G) High-magnification image of IR25a immunostaining (green) in wildtype antennal sections illustrating cilia localization in a coeloconic neuron (E), sacculus neurons (F), and aristal neurons (G). Scale bars are 10 μm.
Figure 6
Figure 6. IR84a mis-expression confers novel olfactory sensitivity to phenylacetaldehyde
(A) Representative traces of extracellular recordings of neuronal responses to the indicated stimuli in control ac3 sensilla (UAS-IR84a/+) (left) and in ac3 sensilla in which IR84a is mis-expressed in OR35a neurons (UAS-IR84a/+;OR35a-GAL4/+) (right). Bars above the traces mark stimulus time (1 s). For these experiments, all odors were used at 1% concentration except for hexanol, which was diluted to 0.001%. (B) Quantification of mean odor responses (± s.e.m; n=8-16, male flies) of the five indicated genotypes (OR35a-GAL4/+ (light grey); UAS-IR84a/+ (dark grey); UAS-IR84a/+;OR35a-GAL4/+ (red); UAS-IR76a/+;OR35a-GAL4/+) (green); UAS-IR75d/+;OR35a-GAL4/+) (blue) to the indicated stimuli [concentrations as described in (A)]). Responses of ac3 sensilla neurons to paraffin oil, propionic acid, hexanol and phenylacetonitrile are not significantly different between genotypes (ANOVA; p>0.1657) whereas responses to phenylacetaldehyde are significantly different in sensilla ectopically expressing IR84a compared to the other genotypes (ANOVA with post-hoc t-tests; p< 0.0001). (C) Representative traces of extracellular recordings of neuronal responses to the indicated dilution of phenylacetaldehyde in control ac3 sensilla (UAS-IR84a/+) (left), in ac3 sensilla in animals in which IR84a is mis-expressed in OR35a neurons (UAS-IR84a/+;OR35a-GAL4/+) (middle) and in ac4 sensilla from UAS-IR84a/+;OR35a-GAL4/+ animals (right). ac3 sensilla were unambiguously identified by their responses to propionic acid and hexanol [see (A-B)]. Bars above the traces mark stimulus time (1 s). (D) Quantification of mean responses to the phenylacetaldehyde stimuli indicated for the three genotypes shown in (C) (± s.e.m; n=10-16, male flies). At 0.1% phenylacetaldehyde, the ac3 + IR84a and ac4 responses are both significantly higher than the control ac3 sensilla (ANOVA with post-hoc t-tests; p< 0.0008); at 1% and 10%, the ac3+ IR84a sensilla responses are significantly higher than ac4 (ANOVA with post-hoc t-tests; p< 0.0001). (E) Plot of dose-responses curves of data shown in (D), in which the ac4 sensilla phenylacetaldehyde responses have been corrected for the paraffin oil response, and the phenylacetaldehyde responses of ac3 + IR84a sensilla have been corrected for both paraffin oil responses and endogenous weak ac3 phenylacetaldehyde responses [grey values in (D)]. The curves are not significantly different at any stimulus concentration (ANOVA; p=0.6629).
Figure 7
Figure 7. IR92a mis-expression confers novel olfactory sensitivity to ammonia
(A) Representative traces of extracellular recordings of neuronal responses to the indicated stimuli in wildtype ac4 sensilla (left), and in ac4 sensilla in animals in which IR92a from ac1 neurons is mis-expressed in IR76a-expressing ac4 neurons (IR76a-GAL4/UAS-IR92a) (right). Bars above the traces mark stimulus time (1 s). (B) Quantification of mean responses to the stimuli indicated for the four genotypes (± s.e.m; n=9-10, male flies). Responses of ac4 sensilla to paraffin oil, water, phenylacetaldehyde (1%) and 1,4-diaminobutane (10%) are not significantly different between genotypes (ANOVA; p> 0.3044) whereas responses to ammonia (10%) are significantly different in flies ectopically expressing IR92a (ANOVA with post-hoc t-tests; p< 0.0001).

Comment in

References

    1. Altschul SF, Madden TL, Schaffer AA, Zhang J, Zhang Z, Miller W, Lipman DJ. Gapped BLAST and PSI-BLAST: a new generation of protein database search programs. Nucleic Acids Res. 1997;25:3389–3402. - PMC - PubMed
    1. Armstrong N, Gouaux E. Mechanisms for activation and antagonism of an AMPA-sensitive glutamate receptor: crystal structures of the GluR2 ligand binding core. Neuron. 2000;28:165–181. - PubMed
    1. Armstrong N, Sun Y, Chen GQ, Gouaux E. Structure of a glutamate-receptor ligand-binding core in complex with kainate. Nature. 1998;395:913–917. - PubMed
    1. Bandell M, Macpherson LJ, Patapoutian A. From chills to chilis: mechanisms for thermosensation and chemesthesis via thermoTRPs. Curr Opin Neurobiol. 2007;17:490–497. - PMC - PubMed
    1. Bargmann CI. Comparative chemosensation from receptors to ecology. Nature. 2006;444:295–301. - PubMed

Publication types