

Area-specific representation of mechanical nociceptive stimuli within SI cortex of squirrel monkeys
- PMID: 19136211
- PMCID: PMC2680084
- DOI: 10.1016/j.pain.2008.11.018
Area-specific representation of mechanical nociceptive stimuli within SI cortex of squirrel monkeys
Abstract
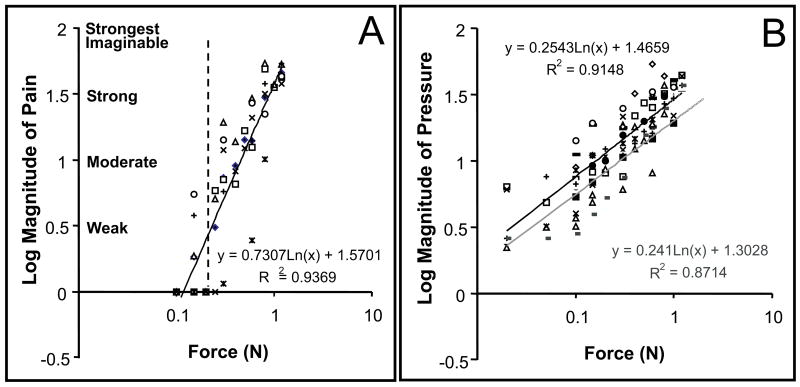
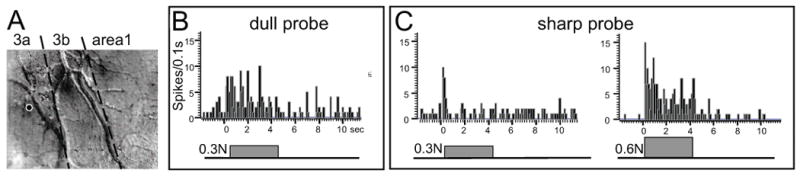
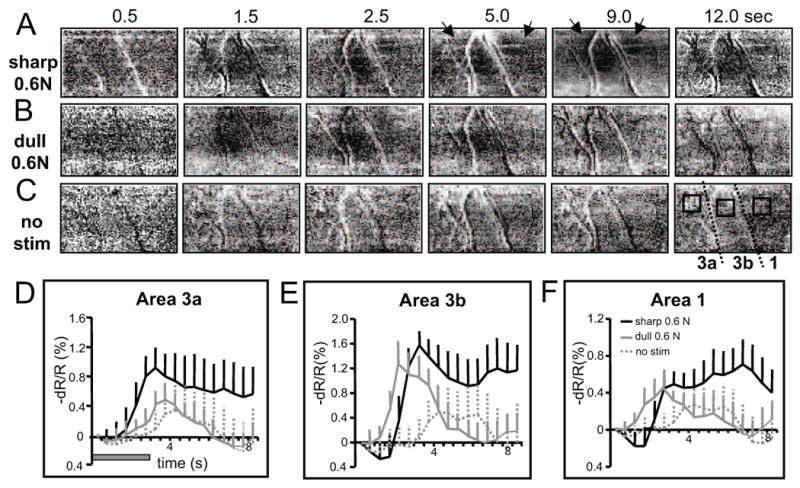
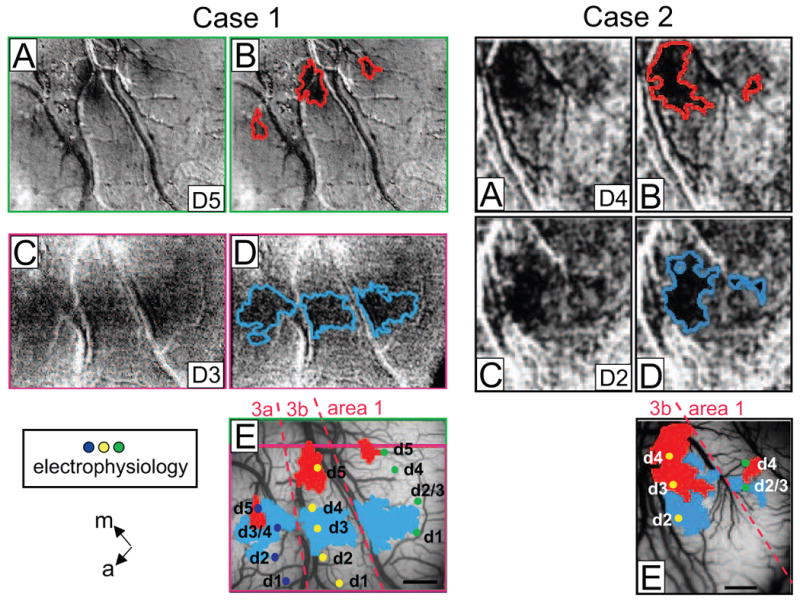
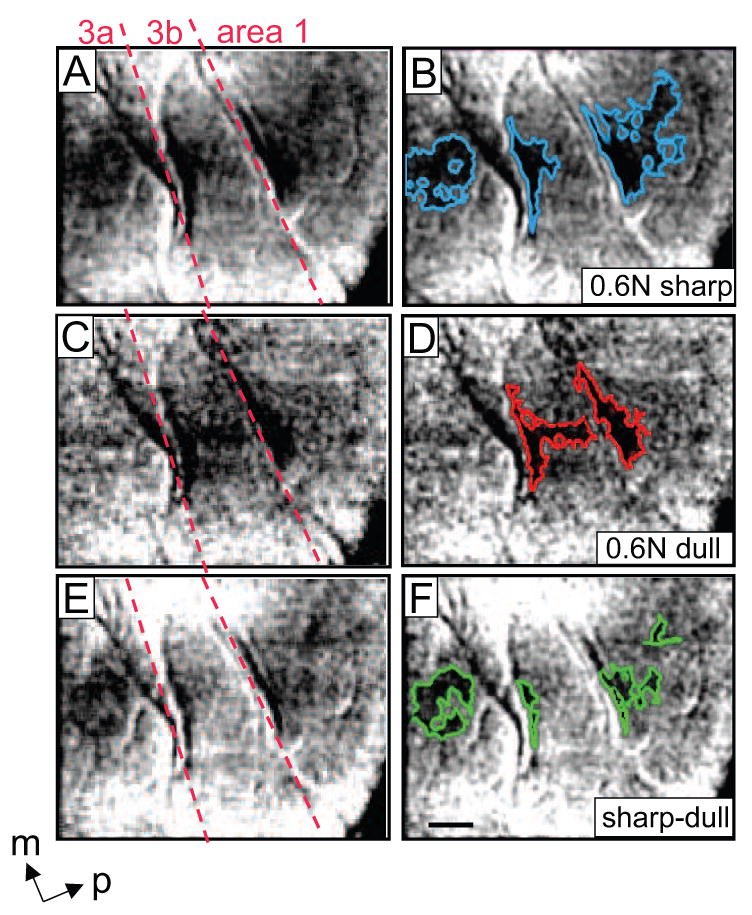
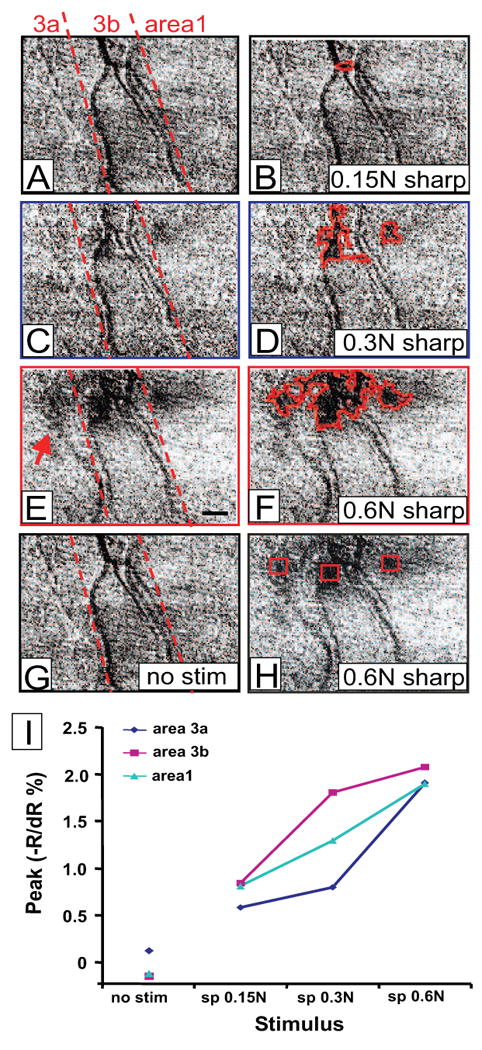
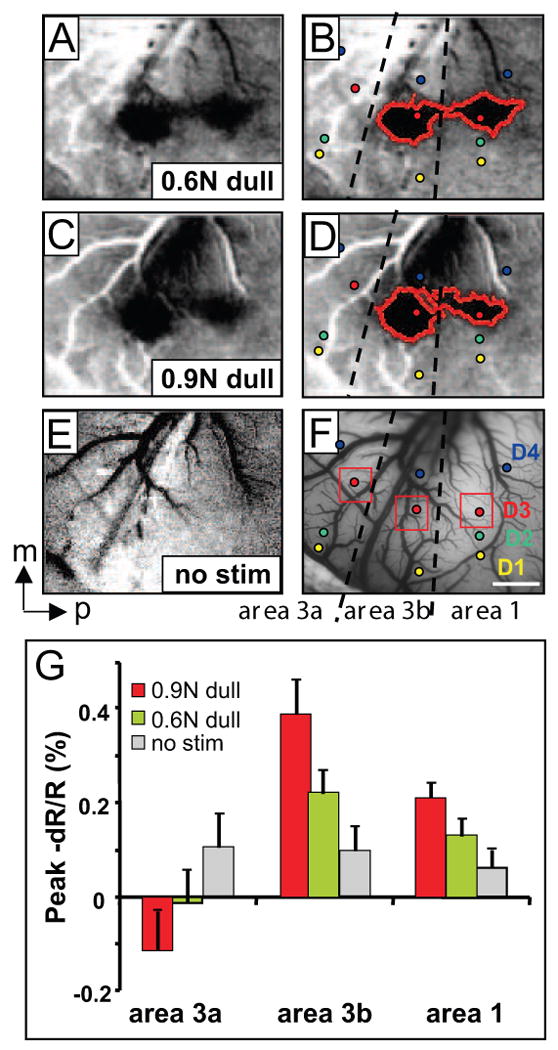
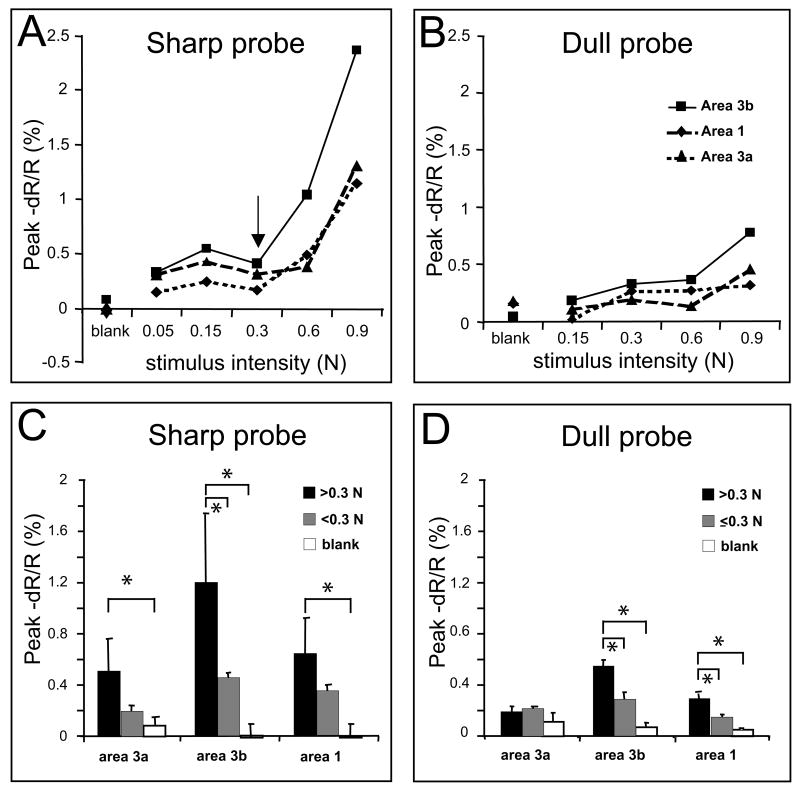
While functional imaging studies in humans have consistently reported activation of primary somatosensory cortex (SI) with painful stimuli, the specific roles of subdivisions of areas 3a, 3b, and 1 within SI during pain perception are largely unknown, particularly in the representation of mechanical evoked pain. In this study, we investigated how modality, location, and intensity of nociceptive stimuli are represented within SI by using high-spatial resolution optical imaging of intrinsic signals in Pentothal-anesthetized squirrel monkeys. Perceptually comparable mechanical nociceptive and innocuous tactile stimuli were delivered by indenting the glabrous skin of the distal finger pads with 0.2 and 2mm diameter probes, respectively. Within each of areas 3a, 3b, and 1, activations to mechanical nociceptive stimulation of individual distal finger pads were spatially distinct and somatotopically organized. We observed differential cortical activation patterns. Areas 3a, 3b, and 1 were all activated during mechanical nociceptive stimulation and were modulated by nociceptive stimulus intensity. However, with innocuous tactile stimulation, mainly areas 3b and 1 exhibited response modulation with different levels of stimulation. In summary, mechanical nociceptive inputs are area-specific and topographically represented within SI. We propose that all areas of SI are implicated in encoding the features of mechanical nociception, where areas 3a and 3b are distinctively involved in coding nociceptive and pressure sensation components of stimulation.
Conflict of interest statement
We declare no conflict of interest in publishing this paper.
Figures
Similar articles
-
High-resolution functional magnetic resonance imaging mapping of noxious heat and tactile activations along the central sulcus in New World monkeys.Pain. 2011 Mar;152(3):522-532. doi: 10.1016/j.pain.2010.10.048. Epub 2010 Dec 21. Pain. 2011. PMID: 21177033 Free PMC article.
-
Optical imaging of nociception in primary somatosensory cortex of non-human primates.Sheng Li Xue Bao. 2008 Oct 25;60(5):664-8. Sheng Li Xue Bao. 2008. PMID: 18958375
-
Responses of areas 3b and 1 in anesthetized squirrel monkeys to single- and dual-site stimulation of the digits.J Neurophysiol. 2008 Dec;100(6):3185-96. doi: 10.1152/jn.90278.2008. Epub 2008 Oct 15. J Neurophysiol. 2008. PMID: 18922955 Free PMC article.
-
Role of primary somatosensory cortex in the coding of pain.Pain. 2013 Mar;154(3):334-344. doi: 10.1016/j.pain.2012.10.021. Epub 2012 Nov 3. Pain. 2013. PMID: 23245864 Free PMC article. Review.
-
[Functional brain mapping of pain perception].Med Sci (Paris). 2011 Jan;27(1):82-7. doi: 10.1051/medsci/201127182. Med Sci (Paris). 2011. PMID: 21299967 Review. French.
Cited by
-
Intrinsic horizontal connections process global tactile features in the primary somatosensory cortex: neuroanatomical evidence.J Comp Neurol. 2013 Aug 15;521(12):2798-817. doi: 10.1002/cne.23317. J Comp Neurol. 2013. PMID: 23436325 Free PMC article.
-
Disrupted population coding in the prefrontal cortex underlies pain aversion.Cell Rep. 2021 Nov 9;37(6):109978. doi: 10.1016/j.celrep.2021.109978. Cell Rep. 2021. PMID: 34758316 Free PMC article.
-
Parallel functional reorganizations of somatosensory areas 3b and 1, and S2 following spinal cord injury in squirrel monkeys.J Neurosci. 2014 Jul 9;34(28):9351-63. doi: 10.1523/JNEUROSCI.0537-14.2014. J Neurosci. 2014. PMID: 25009268 Free PMC article.
-
Differential fMRI activation to noxious heat and tactile stimuli in parasylvian areas of new world monkeys.Pain. 2012 Jan;153(1):158-169. doi: 10.1016/j.pain.2011.10.006. Epub 2011 Nov 23. Pain. 2012. PMID: 22115923 Free PMC article.
-
Somatosensory cortical signature of facial nociception and vibrotactile touch-induced analgesia.Sci Adv. 2022 Nov 18;8(46):eabn6530. doi: 10.1126/sciadv.abn6530. Epub 2022 Nov 16. Sci Adv. 2022. PMID: 36383651 Free PMC article.
References
-
- Apkarian AV, Bushnell MC, Treede RD, Zubieta JK. Human brain mechanisms of pain perception and regulation in health and disease. Eur J Pain. 2005;9:463. - PubMed
-
- Duncan GH, Albanese MC. Is there a role for the parietal lobes in the perception of pain? Adv Neurol. 2003;93:69. - PubMed
-
- Strigo IA, Duncan GH, Boivin M, Bushnell MC. Differentiation of visceral and cutaneous pain in the human brain. J Neurophysiol. 2003;89:3294. - PubMed
-
- Kenshalo DR, Jr, Isensee O. Responses of primate SI cortical neurons to noxious stimuli. J Neurophysiol. 1983;50:1479. - PubMed
Publication types
MeSH terms
Grants and funding
LinkOut - more resources
Full Text Sources
