. 2009 Mar 20;284(12):8114-26.
doi: 10.1074/jbc.M801892200. Epub 2009 Jan 9.

Regulation of podosome formation in macrophages by a splice variant of the sodium channel SCN8A

Affiliations

Regulation of podosome formation in macrophages by a splice variant of the sodium channel SCN8A

Michael D Carrithers et al. J Biol Chem. .

Abstract

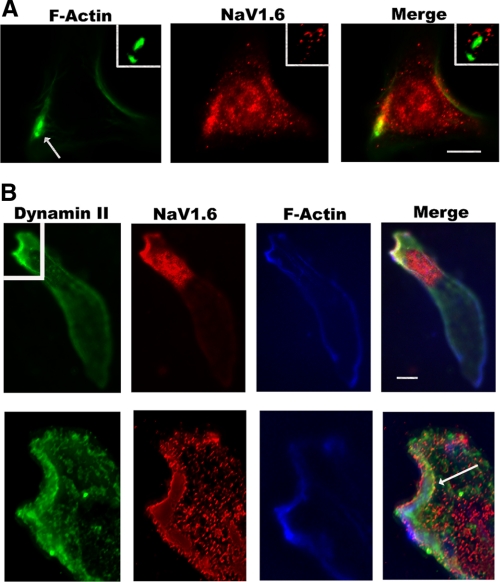
Voltage-gated sodium channels initiate electrical signaling in excitable cells such as muscle and neurons. They also are expressed in non-excitable cells such as macrophages and neoplastic cells. Previously, in macrophages, we demonstrated expression of SCN8A, the gene that encodes the channel NaV1.6, and intracellular localization of NaV1.6 to regions near F-actin bundles, particularly at areas of cell attachment. Here we show that a splice variant of NaV1.6 regulates cellular invasion through its effects on podosome and invadopodia formation in macrophages and melanoma cells. cDNA sequence analysis of SCN8A from THP-1 cells, a human monocyte-macrophage cell line, confirmed the expression of a full-length splice variant that lacks exon 18. Immunoelectron microscopy demonstrated NaV1.6-positive staining within the electron dense podosome rosette structure. Pharmacologic antagonism with tetrodotoxin (TTX) in differentiated THP-1 cells or absence of functional NaV1.6 through a naturally occurring mutation (med) in mouse peritoneal macrophages inhibited podosome formation. Agonist-mediated activation of the channel with veratridine caused release of sodium from cationic vesicular compartments, uptake by mitochondria, and mitochondrial calcium release through the Na/Ca exchanger. Invasion by differentiated THP-1 and HTB-66 cells, an invasive melanoma cell line, through extracellular matrix was inhibited by TTX. THP-1 invasion also was inhibited by small hairpin RNA knockdown of SCN8A. These results demonstrate that a variant of NaV1.6 participates in the control of podosome and invadopodia formation and suggest that intracellular sodium release mediated by NaV1.6 may regulate cellular invasion of macrophages and melanoma cells.


Figures

FIGURE 1.
FIGURE 1.
NaV1.6-positive vesicles are present in high concentrations near invadopodia and the leading edge of HTB-66 cells, an invasive human melanoma cell line. A, NaV1.6-containing vesicles (middle panel, red) are distributed throughout HTB-66 cells, an invasive human melanoma cell line, but are observed in particularly high densities near F-actin (phalloidin-Alexa 488, left panel, green) positive invadopodia structures (arrow; detail in white box shown in upper right). Scale bar, 10 μm. B, at the leading edge of an invasive HTB-66 cell, NaV1.6-positive vesicles (left panel, red) co-localize and are localized to Dynamin II (far left panel, green) and F-actin-positive regions (phalloidin Alexa 350, right panel, blue). There is also a dense collection of Dynamin II-negative, NaV1.6-positive vesicles immediately below the leading edge. Scale bar, 10 μm. In more detailed deconvoluted images (bottom images) of the invadopodia region (detail from white box in upper left), all three proteins appear to be in adjacent compartments within this structure. There is a small degree of co-localization between Dynamin II and NaV1.6 at the leading edge (arrow).
FIGURE 2.
FIGURE 2.
In macrophages, NaV1.6-positive vesicles localize to cellular regions rich in podosomes. A, phalloidin staining of F-actin (left panel, green) in a mouse peritoneal macrophage shows numerous podosomes (circular structures). Staining for NaV1.6 (middle panel, red) demonstrates positive staining of vesicular-type structures, some of which co-localize to the periphery of the F-actin-rich core of the podosome structure (merged image on the right). B, in a mouse peritoneal macrophage, NaV1.6-containing vesicles (red) also co-localize with the calcium-dependent, actin-regulatory protein gelsolin (green), particularly at the leading edge of the cell as compared with the trailing tail. C, a similar staining pattern was observed in differentiated THP-1 cells, a human monocytic cell line, as compared with mouse primary mouse macrophages (A). Centrally located podosomes (far left panel, green) were concentrated in regions rich in NaV1.6-positive vesicles (middle left panel, red) and mitochondria (stained with Mito-Tracker, middle right panel). Scale bar, 10 μm.
FIGURE 3.
FIGURE 3.
Immuno-EM demonstrates localization of NaV1.6 to the electron dense podosome structure. The podosome rosette structure was analyzed in epon-embedded samples (A and B), and NaV1.6 and β-actin subcellular localization were analyzed by cryo-immuno-EM (C-E) in differentiated THP-1 that had been treated with m-CSF (50 ng/ml for 5 min) to enhance podosome and podosome rosette formation. Under these conditions, podosome rosettes appear as circular electron dense structures. A, low power view of a cell demonstrates a podosome rosette as an electron dense structure. Note the mitochondria adjacent to the structure. Scale bar, 1 μm. B, a higher power view shows preserved membrane structure within the rosette. Scale bar, 500 nm. C, cryo-immuno-EM revealed intense immuno-gold staining (black dots) for NaV1.6 within the electron dense podosome rosette structure with less intense staining elsewhere in the cell. Scale bar, 1 μm. D, the electron dense podosome structure also demonstrated intense staining for β-actin. Scale bar, 500 nm. E, double labeling for both NaV1.6 (larger 12-nm gold particles) and actin (smaller 6-nm gold particles) revealed co-localization within the electron dense podosome structure (lower left) and in small membrane vesicles (30-80 nm in diameter) outside of the rosette (arrows). Scale bar, 500 nm.
FIGURE 4.
FIGURE 4.
Absence of a functional NaV1.6 in mouse peritoneal macrophages or function block of the channel with tetrodotoxin in differentiated, human THP-1 cells reduces the number of podosomes. A and B, peritoneal macrophages were harvested from 2-week-old mice homozygous for the med mutation and healthy littermates. Following 1 day in culture, cells were stained for F-actin with Alexa 488 phalloidin. Wild-type cells (A) demonstrated more podosomes (left panels, green) as compared with macrophages from med mice (B). Cells were co-stained with 4′,6′-diamidino-2-phenylindole (DAPI) to reveal nuclei and cells without podosomes (A and B, merged images). As shown in the table below the micrographs, quantitative analysis revealed a statistically significant difference between the number of podosomes per cell in the two conditions. Scale bar, 20 μm. C and D, THP-1 cells were differentiated with phorbol ester for 48 h, incubated in serum-free media for an additional 4 h in the presence and absence of TTX (300 nm), harvested, and allowed to re-adhere to a glass coverslip for 1 h. Cells were then stained with phalloidin. Untreated cells (C) demonstrated a greater number of podosomes than those treated with TTX (D). Quantitative analysis (table below micrographs) revealed statistically significant reduction in the number of podosomes in TTX-treated cells. Scale bar, 10 μm.
FIGURE 5.
FIGURE 5.
Voltage-gated sodium channel activation by the agonist veratridine causes a shift in intracellular sodium from cationic vesicles and the cytosol to the mitochondria. A-D, differentiated, unprimed THP-1 cells, which express NaV1.6, but not NaV1.5, were labeled with Sodium Green and Corona Red and then stimulated for 1 min with veratridine. Following stimulation, there is a clear shift at low magnification from a green predominant staining pattern (A) to red (B), suggesting release of sodium from positively charged compartments and uptake of sodium from the cytosol by mitochondria. Scale bar, 20 μm. At higher magnification (C and D, detailed image of the cell (arrow) in A), separation of the compartments can be distinguished both prior to stimulation (C) and following channel activation (D). Scale bar, 2 μm. Quantitative analysis of these fluorescent shifts was statistically significant (table).
FIGURE 6.
FIGURE 6.
The microscopic results for veratridine-induced sodium flux were confirmed by fluorometry. A, unprimed THP-1 cells were loaded with the ratiometric sodium dye, SBFI, which like Sodium Green predominantly labels the cytoplasm and positively charged organelles. Stimulation with veratridine resulted in a rapid decrease in sodium in those compartments in the absence of extracellular sodium (NaCl replaced by NMDG). The average peak change in fluorescent ratio values was -0.62 ± 0.06 RFU for the NaCl group (n = 5) (tracing not shown) and -0.45 ± 0.03 RFU for the NMDG condition (n = 4) (differences not statistically significant). The intracellular shift from SBFI-labeled compartments to other cellular compartments was calculated to be 9.12 ± 1.38 mm. B, TTX (300 nm) blocked the veratridine-induced response in THP-1 cells (SBFI-NMDG-TTX, -0.13 ± 0.02 RFU, n = 4, p = 0.0001 as compared with SBFI-NMDG-untreated). C, mouse primary peritoneal macrophages were loaded with SBFI and then stimulated with veratridine. A similar decrease was observed following veratridine stimulation as compared with THP-1 cells (-0.70 + 0.06 RFU, n = 3). The decrease was estimated to be 8.48 ± 0.67 mm sodium. D, in HTB-66 cells, an invasive human melanoma line, the veratridine-induced response was -0.40 RFU ± 0.03 (n = 3).
FIGURE 7.
FIGURE 7.
Veratridine activation of voltage-gated sodium channels leads to release of calcium from mitochondria mediated by the Na/Ca exchanger. A--E, THP-1 cells were loaded with the calcium indicator dye Fluo-4 and stimulated with veratridine. A, following a brief injection artifact, there is a delayed but sustained increase in cytosolic calcium in the presence of extracellular calcium. B, when extracellular calcium is buffered with EGTA, the peak response is similar but is not sustained and lasts for ∼2 min. C, this response was almost entirely blocked when the cells were pre-treated with an inhibitor of the mitochondrial Na/Ca exchanger, CGP-37157 in combination with EGTA. The injection response in the absence of cells is shown in D. E, the average peak response was 45.75 ± 9.23 RFU (n = 4) in the presence of extracellular calcium (far left). The peak response was 37.00 ± 3.21 (n = 3) for EGTA alone and 7.33 ± 2.33 (n = 3) in the presence of both EGTA and CGP-37157 (0.02 mm)(p = 0.002).
FIGURE 8.
FIGURE 8.
NaV1.6-deficient mouse peritoneal macrophages lack a veratridine-induced calcium response. A, mouse peritoneal macrophages from 2-3-week-old littermates of NaV1.6-deficient med mice were labeled with the calcium indicator Fura-2 and then stimulated with veratridine (80 μm). With extracellular calcium buffered with EGTA, veratridine induced a transient increase in intracellular calcium (0.15 ± 0.04 change in fluorescent ratio). The approximate change in intracellular calcium was 211 ± 51 nm. B, in peritoneal macrophages from NaV1.6-deficient med mice, there was no response or a slight negative response (-0.07 ± 0.03, p = 0.019). Representative tracings are shown for both conditions.
FIGURE 9.
FIGURE 9.
m-CSF, an inducer of podosome formation, stimulates a transient intracellular sodium flux that can be blocked by tetrodotoxin. A and B, THP-1 cells were labeled with the sodium indicator dye, SBFI, and then stimulated in the absence of extracellular sodium (NMDG buffer, see “Experimental Procedures”) with m-CSF (10 ng/ml), a known inducer of podosomes in monocyte-macrophages. m-CSF caused a transient decrease in sodium concentration that could be blocked by pre-treatment with TTX (300 nm). The peak response was 0.24 ± 0.6 RFU in the absence of TTX.
FIGURE 10.
FIGURE 10.
shRNA knockdown of SCN8A, the gene that encodes NaV1.6, prevents m-CSF induced podosome formation. shRNA clones were screened for their ability to knockdown expression of SCN8A (Table 1). Two clones, THP clone 89 and THP clone 92, were selected for further functional analysis based on their ability to either knockdown expression of SCN8A mRNA by >85% (clone 89) or by lack of gene knockdown (clone 92, control) (Table 1). A, decreased expression of NaV1.6 in clone 89 cells was confirmed by Western blot analysis. B and C, following a brief stimulation with m-CSF (5 min), podosome induction was measured by phalloidin staining. The podosomes identified in the knockdown cells were smaller and the overall F-actin content was decreased. Scale bar, 10 μm. D, the average densitometric sum per cell was 76.33 ± 13.96 RFU for control THP clone 92 cells and 3.66 ± 1.93 RFU for the knockdown THP clone 89 cells (p = 0.0005; n = 10-14 microscopic fields per condition).
FIGURE 11.
FIGURE 11.
Invasion of differentiated THP-1 cells and HTB-66 cells through extracellular matrix is blocked by tetrodotoxin, but migration is unaffected. Invasion of differentiated THP-1 and HTB-66 through reconstituted basement membrane was measured in a transwell assay. A, for THP-1 cells, in response to varying concentrations of m-CSF, TTX (300 nm) significantly inhibited invasion at all concentrations examined. Invasion, normalized to nonspecific invasion in the absence of stimulus, was 31,779 ± 10,798 RFU in the untreated group versus -5,080 ± 6,656 in the TTX group at 25 ng/ml m-CSF (n = 6; p = 0.019); 71,382 ± 12,209 versus 12,850 ± 12,406 at 100 ng/ml m-CSF (n = 6; p = 0.007); and 87,446 ± 15,216 versus 25,133 ± 17,752 at 400 ng/ml m-CSF (n = 6; p = 0.02). B, in a similar manner, TTX also blocked invasion of HTB-66 cells in response to 10% FBS. In the untreated condition invasion was 70,691 ± 14,700 RFU as compared with -10,244 + 9,302 (n = 5; p = 0.003). C, in contrast, migration of THP-1 cells through a 5-μm pore in a transwell assay was not affected by TTX treatment (300 nm). Varying concentrations of MCP-1 were used as the chemotractant (7.5 to 250 ng/ml for 2 h). Migration, normalized to nonspecific migration in the absence of stimulus, was 151,720 ± 19,816 RFU in the untreated group versus 183,610 ± 11,711 in the TTX group at 7.5 ng/ml MCP-1, 259,570 ± 79,161 versus 214,450 ± 36,795 at 15 ng/ml MCP-1, 255,780 ± 51,738 versus 267,820 ± 62,777 at 31 ng/ml MCP-1, 377,600 ± 127,550 versus 347,200 ± 138,330 at 62.5 ng/ml MCP-1, 325,860 ± 74,887 versus 267,590 ± 43,929 at 125 ng/ml MCP-1, and 197,100 ± 57,302 versus 239,610 ± 33,218 at 250 ng/ml MCP-1 (n = 4 for each condition, no differences were statistically significant). D, invasion also was assessed in shRNA knockdown THP-1 clones. SCN8A knockdown clone 89 THP-1 cells (3,126 ± 3,793 RFU, n = 6) showed almost complete absence of invasion through reconstituted basement membrane in response to m-CSF (100 ng/ml) as compared with control clone 92 THP-1 (65,716 ± 5,774 RFU, n = 6) and wild-type cells (42,053 ± 1,761 RFU, n = 6) (p < 0.0001 for clone 89 as compared with either clone 92 or wild type).

Similar articles

Cited by

References

    1. Catterall, W., Goldin, A., and Waxman, S. (2005) Pharmacol. Rev. 57 397-409 - PubMed
    1. Lowe, D., Richardson, B., Taylor, P., and Donatsch, P. (1976) Nature 260 337-338 - PubMed
    1. Leblanc, N., and Hume, J. (1990) Science 248 372-376 - PubMed
    1. Blumenstein, Y., Maximyuk, O., Lozovaya, N., Yatsenko, N., Kanevsky, N., Krishtal, O., and Dascal, N. (2004) J. Physiol. 556 121-134 - PMC - PubMed
    1. Nikolaeva, M., Mukherjee, B., and Stys, P. (2005) J. Neurosci. 25 9960-9967 - PMC - PubMed

Publication types

MeSH terms