. 2009 Jan;21(1):267-84.
doi: 10.1105/tpc.108.063693. Epub 2009 Jan 9.

Rearrangement of actin cytoskeleton mediates invasion of Lotus japonicus roots by Mesorhizobium loti

Affiliations

Rearrangement of actin cytoskeleton mediates invasion of Lotus japonicus roots by Mesorhizobium loti

Keisuke Yokota et al. Plant Cell. 2009 Jan.

Abstract

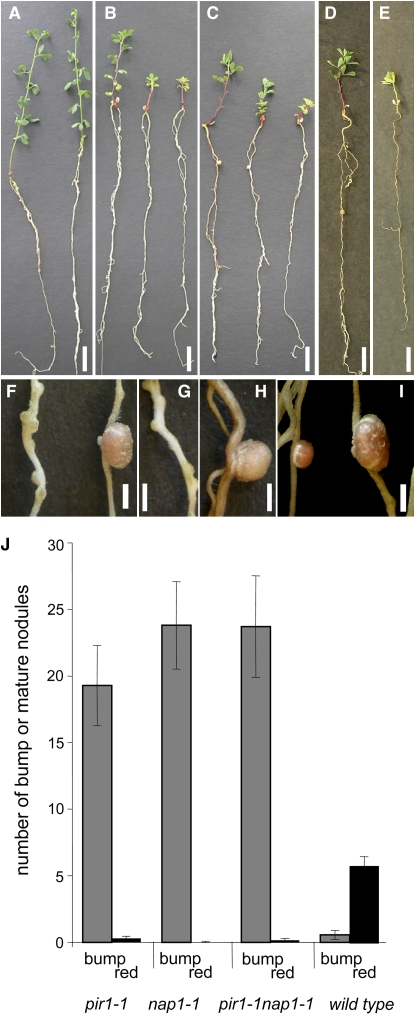
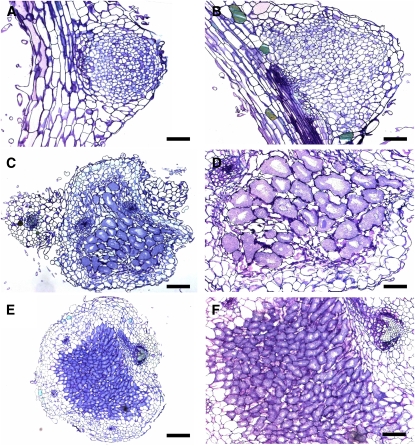
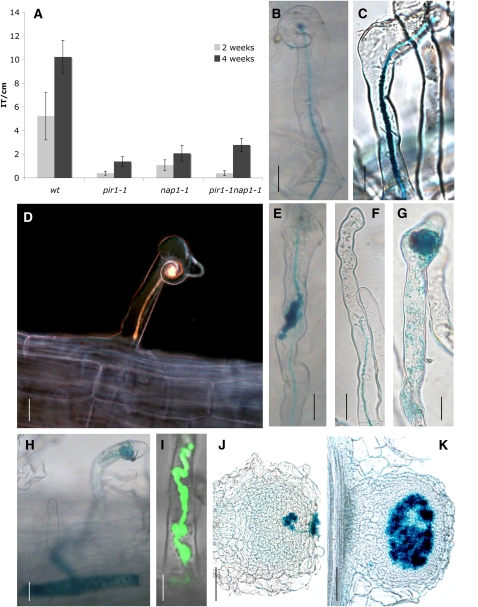
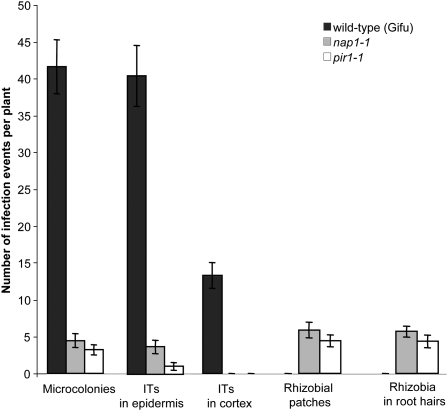
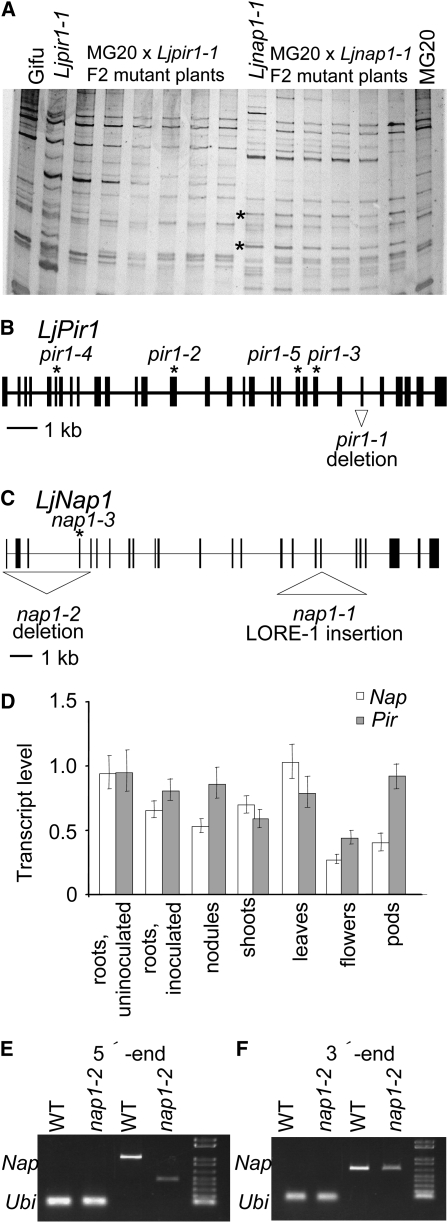
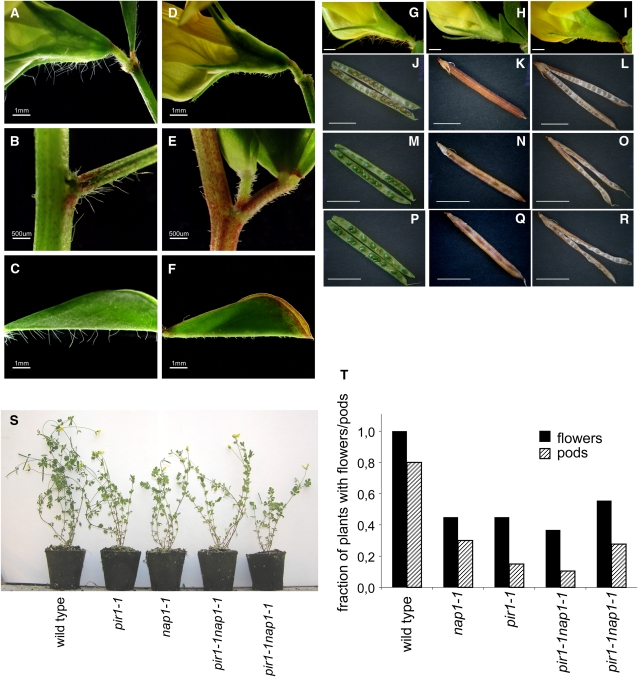
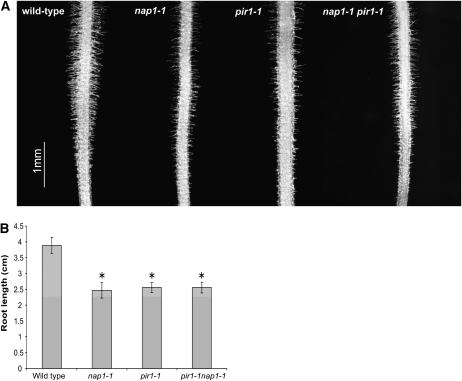
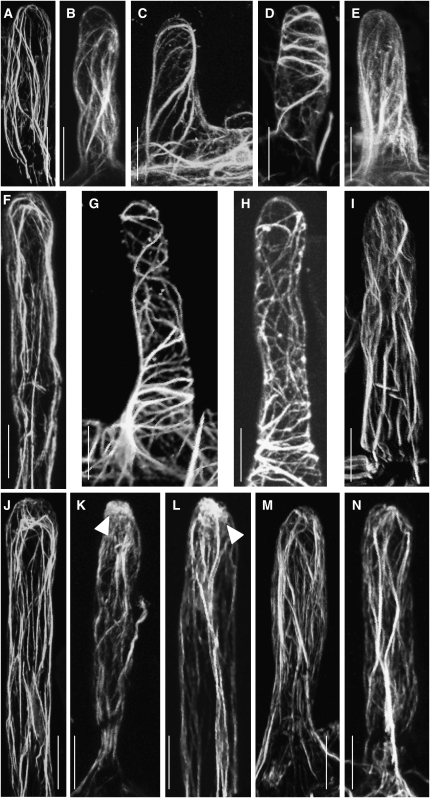
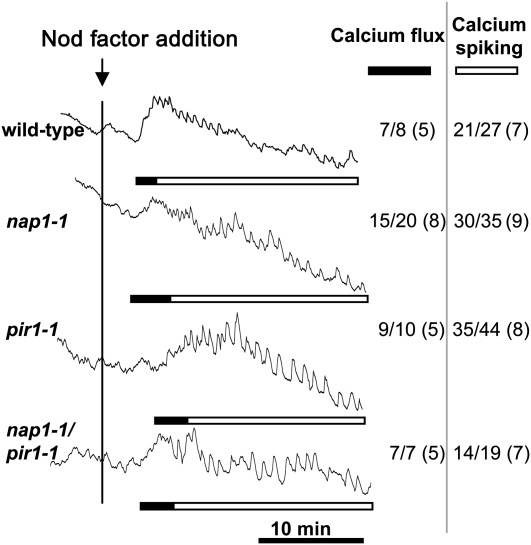
Infection thread-dependent invasion of legume roots by rhizobia leads to internalization of bacteria into the plant cells, which is one of the salient features of root nodule symbiosis. We found that two genes, Nap1 (for Nck-associated protein 1) and Pir1 (for 121F-specific p53 inducible RNA), involved in actin rearrangements were essential for infection thread formation and colonization of Lotus japonicus roots by its natural microsymbiont, Mesorhizobium loti. nap1 and pir1 mutants developed an excess of uncolonized nodule primordia, indicating that these two genes were not essential for the initiation of nodule organogenesis per se. However, both the formation and subsequent progression of infection threads into the root cortex were significantly impaired in these mutants. We demonstrate that these infection defects were due to disturbed actin cytoskeleton organization. Short root hairs of the mutants had mostly transverse or web-like actin filaments, while bundles of actin filaments in wild-type root hairs were predominantly longitudinal. Corroborating these observations, temporal and spatial differences in actin filament organization between wild-type and mutant root hairs were also observed after Nod factor treatment, while calcium influx and spiking appeared unperturbed. Together with various effects on plant growth and seed formation, the nap1 and pir1 alleles also conferred a characteristic distorted trichome phenotype, suggesting a more general role for Nap1 and Pir1 in processes establishing cell polarity or polar growth in L. japonicus.


Figures

Figure 1.
Figure 1.
Whole Plant and Nodulation Phenotype of L. japonicus Wild-Type, pir1-1, nap1-1, and pir1-1 nap1-1 Mutant Plants. (A) Wild-type L. japonicus. (B) pir1-1. (C) nap1-1. (D) and (E) pir1-1 nap1-1 double mutant. (F) pir1-1 Fix bump (left) and one of the rare oversized red nitrogen-fixing nodules (right). (G) nap1-1 Fix nodules. (H) One of the rare nap1-1 oversized red nitrogen-fixing nodules. (I) Size comparison between L. japonicus wild-type (left) and an oversized pir1-1 nodule (right). Bars = 1 cm in (A) to (E) and 2 mm in (F) to (I). (J) Nodule numbers on 6-week-old nap1-1, pir1-1, pir1-1 nap1-1, and wild-type plants inoculated with M. loti NZP2235. Black columns: mature, red nodules (red); gray columns: white immature, Fix nodules (bump). Bars indicate 95% confidence intervals.
Figure 2.
Figure 2.
Light Microscopy of Nodule Sections. (A) Thin section of pir1-1 noninfected white bump. (B) Close-up of nap1-1 noninfected bump. (C) Thin section of large, red, infected nap1-1 nodule. (D) Close-up of bacteroid-containing cells in large, red nap1-1 nodule. Note the enlarged size of the cells. (E) Wild-type nodule. (F) Wild-type nodule; close-up of the bacteroid-containing cells. Bars = 100 μm in (A), (C), and (E) and 50 μm in (B), (D), and (F). [See online article for color version of this figure.]
Figure 3.
Figure 3.
IT Formation in Wild-Type, pir1-1, nap1-1, nap1-2, and pir1-1 nap1-1 Mutants. (A) Number of ITs per centimeter in wild-type, pir1-1, nap1-1, and pir1-1 nap1-1. The roots were harvested at 2 and 4 weeks after inoculation with rhizobia. The values are presented with 95% confidence intervals. (B) IT (blue color) in wild-type plant 2 weeks after inoculation with M. loti expressing lacZ. The root hair is curling in response to rhizobia, and the IT develops reaching the base of the root hair. (C) IT in the nap1-1 mutant, wild-type-like. (D) nap1-2 IT stopping in the first epidermis cell. (E) IT in nap1-1 with inflated sac-like structure on the IT containing rhizobia. (F) to (I) Various stages of IT damage, from partially burst IT releasing rhizobia into root hair to totally disrupted ITs. pir1-1 nap1-1 double mutant (F), nap1-1 ([G] and [H]), and inflated sac-like structure on a nap1-1 IT and release of rhizobia expressing GFP (I). (J) Colonization attempts from rhizobial patch on a nap1-2 bump. (K) Wild-type nodule showing cells colonized with rhizobia. For (B) to (H), (J), and (K), inoculation was with an M. loti–expressing lacZ. Bars = 20 μm, except for (J) and (K), where bars = 100 μm.
Figure 4.
Figure 4.
Early Infection Events in lotus Wild-Type, nap1-1, and pir1-1 Mutants. Microcolonies and ITs were scored 10 d after inoculation with the M. loti strain expressing lacZ. The ITs were grouped into two categories: those present only within the epidermis (ITs in epidermis) and those that managed to penetrate the root cortex (ITs in cortex). In addition, the presence of M. loti at the surface of nodule primordia (rhizobial patches), or within root hairs in the absence of accompanying IT structures, were quantified and compared between wild-type and mutant plants. Mean values ± 95% confidence intervals are given for each genotype and category (n = 20).
Figure 5.
Figure 5.
Cloning, Gene Structure, and Expression Patterns of Nap1 and Pir1 Genes. (A) SSAP detection of LORE-1 element integrations in pir1-1 and nap1-1 mutant plants compared with parental lines L. japonicus Gifu and Miyakojima MG20. Asterisk indicates new integration in the nap1-1 allele. Both bands represent the same integration event. (B) Pir1 gene structure. Positions of mutations in the pir1-1, pir1-2, pir1-3, pir1-4, and pir1-5 alleles are indicated. (C) Nap1 gene structure. Positions of the mutations in the nap1-1, nap1-2, and nap1-3 alleles are indicated. In (B) and (C), filled rectangles indicate exons, and thin lines indicate introns. (D) Relative levels of Nap1 and Pir1 mRNA in different wild-type lotus organs. The level in uninoculated roots is set to 1 for each gene. Bars represent 95% confidence intervals. (E) and (F) RT-PCR detection of 5′- and 3′-ends of the Nap1 transcript in leaves of the nap1-2 mutant and wild-type plants. In each panel: lanes 1 and 2 are wild-type and nap1-2 ubiquitin controls; lane 3 and 4 are wild-type and nap1-2 Nap1 transcripts; lane 5 is the size marker.
Figure 6.
Figure 6.
Trichome and Growth Phenotype of L. japonicus Wild-Type Gifu, nap1-1, pir1-1, and pir1-1 nap1-1 Double Mutant Plants. (A) to (F) Trichomes on the wild type ([A] to [C]) and the nap1-2 mutant ([D] to [F]). Images of trichomes formed on fully expanded flowers ([A] and [D]), stem internodes ([B] and [E]), and the abaxial surface of the leaf midvein ([C] and [F]) are shown. Bars = 1 mm in (A), (C), (D), and (F) and 500 μm in (B) and (E). (G) to (I) Flower of wild-type (G), pir1-1 (H), and nap1-1 (I) showing the trichome phenotype of the sepals. Bars = 5 mm. (J) to (R) Pod and seed phenotype of wild-type ([J] to [L]), pir1-1 ([M] to [O]), and nap1-1 ([P] to [R]). Bars = 1 cm. (S) and (T) Shoot growth phenotype and developmental status of 9-week-old soil-grown wild-type, pir1-1, nap1-1, and pir1-1 nap1-1 plants. The fractions of plants that reached the stages of flowering (black bars) and pod development (cross hatched bars) are shown. Results are shown for two different pir1-1 nap1-1 lines.
Figure 7.
Figure 7.
Root Development in L. japonicus Wild-Type Gifu, nap1-1, pir1-1, and pir1-1 nap1-1 Mutants. (A) Light microscopy images of root segments (root tip toward bottom) showing diminished root hair development in the mutant plants compared with the wild-type control. The depicted differences in root hair density between individual mutant lines reflect the range of variation observed independently in each mutant genetic background tested. (B) Root length of 7-d-old seedlings, showing significantly (*P < 0.05 in a t test) reduced elongation of the mutant roots. Mean values ± 95% confidence intervals are given for each genotype (n = 20).
Figure 8.
Figure 8.
Actin Cytoskeleton of Root Hairs, Visualized by Alexa-Phalloidin Staining or Expression of the 35S:GFP-ABD2-GFP F-Actin Reporter in Transgenic Roots. (A) to (E) Short root hairs (40 to 50 μm). (F) to (I) Medium length root hairs (80 to 100 μm). (J) to (N) Long root hairs (>120 μm). (A) Wild-type root hair, phalloidin-stained actin. (B) Wild-type root hair; actin visualized using the 35S:GFP-ABD2-GFP F-actin reporter. (C) Actin filaments in pir1-1 root hairs, phalloidin. (D) Actin filaments in pir1-1 root hairs, F-actin reporter. (E) Actin filaments in nap1-1 root hairs, phalloidin. (F) Wild-type root hair, F-actin reporter. (G) and (H) Examples of actin filaments in pir1-1 root hairs, F-actin reporter. (I) Actin filaments in nap1-1 root hairs, F-actin reporter. (J) Wild-type root hair before Nod factor application, phalloidin. (K) Wild-type root hair 30 min after Nod factor application. Note the zone of diffuse actin accumulation at the tip of the root hair (arrowhead), phalloidin. (L) Wild-type root hair 30 min after M. loti inoculation. Note the zone of diffuse actin accumulation at the tip of the root hair (arrowhead), phalloidin. (M) pir1-1 root hair 30 min after application of Nod factor, phalloidin. (N) nap1-1 root hair 30 min after application of Nod factor, phalloidin. Bars = 20 μm.
Figure 9.
Figure 9.
Nod Factor–Induced Calcium Flux and Calcium Spiking in L. japonicus nap1-1, pir1-1, and pir1-1 nap1-1 Mutants. Calcium levels were monitored in individual root hairs of the wild type and nap1-1, pir1-1, and pir1-1 nap1-1 mutants following addition of 100 nM M. loti Nod factor (black vertical line). The ratios (arbitrary units) of fluorescence of Oregon Green (calcium sensitive) to Texas Red (calcium insensitive) were recorded every 5 s for >30 min. The number of cells showing calcium spiking or calcium flux is shown in the inset table as a fraction of the total number of cells analyzed (with the total number of plants tested in parentheses). Solid bars indicate region of the trace where there is a significant transient increase in cellular calcium particularly at the root tip compared with other cytoplasmic or nuclear regions, and the open bars indicate the parts of the traces showing nuclear-associated calcium spiking.

Similar articles

Cited by

References

    1. Allen, N.S., Bennett, M.N., Cox, D.N., Shipley, A., Ehrhardt, D.W., and Long, S.R. (1994). Effects of Nod factors on alfalfa root hair Ca++ and H+ currents and on cytoskeletal behavior. In Advances in Molecular Genetics of Plant-Microbe Interactions, Vol. 3. M.J. Daniels, J.A. Downie, and A.E. Osbourn, eds (Dordrecht, The Netherlands: Kluwer Academic Publishers), pp. 107–113.
    1. Ané, J.-M., et al. (2004). Medicago truncatula DMI1 required for bacterial and fungal symbioses in legumes. Science 303 1364–1367. - PubMed
    1. Bannigan, A., and Baskin, T.I. (2005). Directional cell expansion – Turning toward actin. Curr. Opin. Plant Biol. 8 619–624. - PubMed
    1. Basu, D., El-Din El-Assl, S., Le, J., Mallery, E.L., and Szymanski, D.B. (2004). Interchangeable functions of Arabidopsis PIROGI and the human WAVE complex subunit SRA1 during leaf epidermal development. Development 131 4345–4355. - PubMed
    1. Boivin, C., Camut, S., Malpica, C.A., Truchet, G., and Rosenberg, C. (1990). Rhizobium meliloti genes encoding catabolism of trigonelline are induced under symbiotic conditions. Plant Cell 2 1157–1170. - PMC - PubMed

Publication types

MeSH terms

Associated data