

Beta-Cell hyperplasia induced by hepatic insulin resistance: role of a liver-pancreas endocrine axis through insulin receptor A isoform
- PMID: 19136656
- PMCID: PMC2661585
- DOI: 10.2337/db08-0551
Beta-Cell hyperplasia induced by hepatic insulin resistance: role of a liver-pancreas endocrine axis through insulin receptor A isoform
Abstract
Objective: Type 2 diabetes results from a combination of insulin resistance and impaired insulin secretion. To directly address the effects of hepatic insulin resistance in adult animals, we developed an inducible liver-specific insulin receptor knockout mouse (iLIRKO).
Research design and methods: Using this approach, we were able to induce variable insulin receptor (IR) deficiency in a tissue-specific manner (liver mosaicism).
Results: iLIRKO mice presented progressive hepatic and extrahepatic insulin resistance without liver dysfunction. Initially, iLIRKO mice displayed hyperinsulinemia and increased beta-cell mass, the extent of which was proportional to the deletion of hepatic IR. Our studies of iLIRKO suggest a cause-and-effect relationship between progressive insulin resistance and the fold increase of plasma insulin levels and beta-cell mass. Ultimately, the beta-cells failed to secrete sufficient insulin, leading to uncontrolled diabetes. We observed that hepatic IGF-1 expression was enhanced in iLIRKO mice, resulting in an increase of circulating IGF-1. Concurrently, the IR-A isoform was upregulated in hyperplastic beta-cells of iLIRKO mice and IGF-1-induced proliferation was higher than in the controls. In mouse beta-cell lines, IR-A, but not IR-B, conferred a proliferative capacity in response to insulin or IGF-1, providing a potential explanation for the beta-cell hyperplasia induced by liver insulin resistance in iLIRKO mice.
Conclusions: Our studies of iLIRKO mice suggest a liver-pancreas endocrine axis in which IGF-1 functions as a liver-derived growth factor to promote compensatory pancreatic islet hyperplasia through IR-A.
Figures


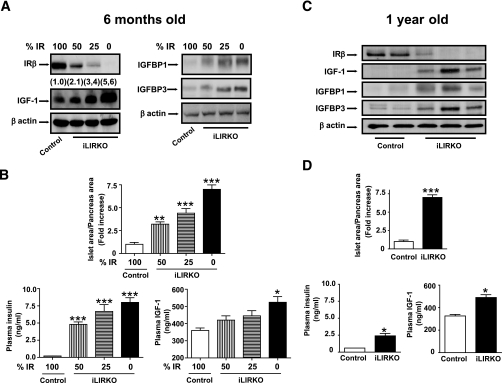
 ; mice with 25% IR, ▤; mice with 0% IR, ■), results shown as fold increase of β-cell mass in control animals, n = 7–15 of each group. Lower left panel: plasma insulin content was measured in 6-month-old male control (□) and iLIRKO mice (50% IR, ; 25% IR, ▤; 0% IR, ■) by RIA (Linco); values are expressed as means ± SEM from four animals per genotype. Lower right panel: plasma IGF-1 content was measured in 6-month-old male control (□) and iLIRKO mice (50% IR, ; 25% IR, ▤; 0% IR, ■) by RIA (Diagnostic Systems Laboratories). Values expressed as mean ± SEM from four animals per genotype. C: Liver extracts from 1-year-old control and iLIRKO mice were analyzed by Western blot with anti-IR β-chain, IGF-1, IGFBP1, IGFBP3, and β-actin antibodies. A representative experiment out of four is shown. D, upper panel: β-cell mass was evaluated by point-counting morphometry in 1-year-old control and iLIRKO mice; results are presented as fold increase of the control β-cell mass. Lower left panel: plasma insulin content was measured in 1-year-old male control and iLIRKO mice by RIA (Linco); values are expressed as means ± SEM from four animals per genotype. Lower right panel: plasma IGF-1 content was measured in 1-year-old male control and iLIRKO mice by RIA (Linco); values are expressed as means ± SEM from four animals per genotype.*P < 0.05, **P < 0.005, and ***P < 0.001 iLIRKO versus control.
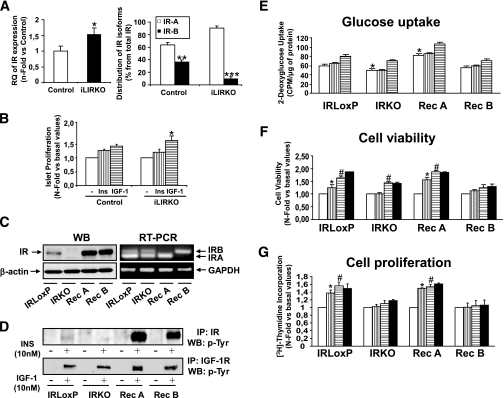 ; 10 nmol/l IGF-1, ▤) and BrdU was added for 24 h. Finally, the BrdU incorporation was measured as indicated by the manufacturer. Values are expressed as mean ± SEM; n = 4 of each genotype. Data were subjected to ANOVA with Bonferroni post-test (*P < 0.05; IGF-1 vs. basal in iLIRKO mice). C: IR expression was analyzed by Western blot and RT-PCR in IRLoxP, IRKO, Rec A, and Rec B β-cells. Arrow at the RT-PCR panels indicates the IR-A and IR-B. A representative experiment out of four is shown. D: Functional assessment of insulin receptor reconstitution was carried out by immunoprecipitation of insulin– or IGF-1–stimulated β-cells with antibodies against IR or IGF-1R and subsequent Western blot against phospho-tyrosine residues. E: IRLoxP, IRKO, Rec A, and Rec B β-cells were cultured to 80% confluence and then serum and glucose starved for 4–6 h. Glucose uptake induced by insulin () or IGF-1 (▤) was measured as described in ), 10 nmol/l IGF-1 (▤), or both (■) were added to the wells in serum-starved 5 mmol/l glucose DMEM. After 24 h, the medium was withdrawn and the four cell lines were stained with violet crystal as described in ), 10 nmol/l IGF-1 (▤), or both (■) were added to the wells in serum-starved 5 mmol/l glucose DMEM for 24 h. Thymidine incorporation was measured in these conditions as described in
 Similar articles
-
Insulin receptor isoform A confers a higher proliferative capability to pancreatic beta cells enabling glucose availability and IGF-I signaling.Mol Cell Endocrinol. 2015 Jul 5;409:82-91. doi: 10.1016/j.mce.2015.03.008. Epub 2015 Mar 19. Mol Cell Endocrinol. 2015. PMID: 25797178
-
Severe Hepatic Insulin Resistance Induces Vascular Dysfunction: Improvement by Liver-Specific Insulin Receptor Isoform A Gene Therapy in a Murine Diabetic Model.Cells. 2021 Aug 9;10(8):2035. doi: 10.3390/cells10082035. Cells. 2021. PMID: 34440804 Free PMC article.
-
Insulin resistance causes increased beta-cell mass but defective glucose-stimulated insulin secretion in a murine model of type 2 diabetes.Diabetologia. 2006 Jan;49(1):90-9. doi: 10.1007/s00125-005-0045-y. Epub 2005 Dec 15. Diabetologia. 2006. PMID: 16362284
-
Apoptosis in the beta cells: cause or consequence of insulin secretion defect in diabetes?Ann Med. 2002;34(6):444-50. doi: 10.1080/078538902321012397. Ann Med. 2002. PMID: 12523500 Review.
-
Role of insulin in glucose-stimulated insulin secretion in beta cells.Curr Diabetes Rev. 2005 Aug;1(3):309-30. doi: 10.2174/157339905774574301. Curr Diabetes Rev. 2005. PMID: 18220607 Review.
Cited by
-
Evolution of hepatic steatosis to fibrosis and adenoma formation in liver-specific growth hormone receptor knockout mice.Front Endocrinol (Lausanne). 2014 Dec 18;5:218. doi: 10.3389/fendo.2014.00218. eCollection 2014. Front Endocrinol (Lausanne). 2014. PMID: 25566190 Free PMC article.
-
Hepatocyte-specific deletion of Janus kinase 2 (JAK2) protects against diet-induced steatohepatitis and glucose intolerance.J Biol Chem. 2012 Mar 23;287(13):10277-10288. doi: 10.1074/jbc.M111.317453. Epub 2012 Jan 24. J Biol Chem. 2012. PMID: 22275361 Free PMC article.
-
Epigenetics of Hepatic Insulin Resistance.Front Endocrinol (Lausanne). 2021 May 11;12:681356. doi: 10.3389/fendo.2021.681356. eCollection 2021. Front Endocrinol (Lausanne). 2021. PMID: 34046015 Free PMC article. Review.
-
Mecasermin in Insulin Receptor-Related Severe Insulin Resistance Syndromes: Case Report and Review of the Literature.Int J Mol Sci. 2018 Apr 24;19(5):1268. doi: 10.3390/ijms19051268. Int J Mol Sci. 2018. PMID: 29695048 Free PMC article. Review.
-
Aberrant liver insulin receptor isoform a expression normalises with remission of type 2 diabetes after gastric bypass surgery.PLoS One. 2015 Mar 5;10(3):e0119270. doi: 10.1371/journal.pone.0119270. eCollection 2015. PLoS One. 2015. PMID: 25742416 Free PMC article.
References
-
- Kahn CR: Banting Lecture: Insulin action, diabetogenes, and the cause of type 2 diabetes. Diabetes 43: 1066– 1084, 1994 - PubMed
-
- Kahn CR: Diabetes: causes of insulin resistance. Nature 373: 384– 385, 1995 - PubMed
-
- Nandi A, Kitamura Y, Kahn CR, Accili D: Mouse models of insulin resistance. Physiol Rev 84: 623– 647, 2004 - PubMed
-
- Kitamura T, Kahn CR, Accili A: Insulin receptor knockout mice. Annu Rev Physiol 65: 313– 332, 2003 - PubMed
-
- Accili D, Drago J, Lee EJ, Johnson MD, Cool MH, Salvatore P, Asico LD, Jose PA, Taylor SI, Westphal HD: Early neonatal death in mice homozygous for a null allele of the insulin receptor gene. Nat Genet 12: 106– 109, 1996 - PubMed
Publication types
MeSH terms
Substances
LinkOut - more resources
Full Text Sources
Medical
Molecular Biology Databases
Miscellaneous
