. 2009 Feb;8(2):151-8.
doi: 10.1038/nmat2357. Epub 2009 Jan 11.

Infection-mimicking materials to program dendritic cells in situ

Affiliations

Infection-mimicking materials to program dendritic cells in situ

Omar A Ali et al. Nat Mater. 2009 Feb.

Abstract

Cancer vaccines typically depend on cumbersome and expensive manipulation of cells in the laboratory, and subsequent cell transplantation leads to poor lymph-node homing and limited efficacy. We propose that materials mimicking key aspects of bacterial infection may instead be used to directly control immune-cell trafficking and activation in the body. It is demonstrated that polymers can be designed to first release a cytokine to recruit and house host dendritic cells, and subsequently present cancer antigens and danger signals to activate the resident dendritic cells and markedly enhance their homing to lymph nodes. Specific and protective anti-tumour immunity was generated with these materials, as 90% survival was achieved in animals that otherwise die from cancer within 25 days. These materials show promise as cancer vaccines, and more broadly suggest that polymers may be designed to program and control the trafficking of a variety of cell types in the body.


Figures

Figure 1
Figure 1. The concentration dependent effects of GM-CSF on DC proliferation, recruitment, activation and emigration in vitro: implications for in situ programming systems
(A) The in vitro migration of JAWSII DCs induced by the indicated concentrations of GM-CSF in transwell systems. Migration counts measured at 12 hours. (B) The effects of GM-CSF concentration on the proliferation of JAWSII DCs. 0 (□), 50 (■), and 500 ng/ml (■) of GM-CSF. (C) The effects of the indicated concentrations of GM-CSF on JAWS II DC emigration from the top wells of transwell systems toward media supplemented with 300 ng/ml CCL19. Migration counts taken at 6 hours. (D) Representative photomicrographs of TNF-α and LPS stimulated JAWSII DCs cultured in 5-50 or 500 ng/ml GM-CSF and stained for the activation markers MHCII and CCR7. Scale bar in (D) - 20 μm. Values in (A-C) represent mean and standard deviation (n=4) and * P<0.05 ** P<0.01
Figure 2
Figure 2. In vivo control of DC recruitment and programming
(A) Cumulative release of GM-CSF from PLG matrices over a period of 23 days. (B) H&E staining of sectioned PLG scaffolds explanted from subcutaneous pockets in the backs of C57BL/6J mice after 14 days: Blank scaffolds, and GM-CSF (3000 ng) loaded scaffolds. (C) FACS plots of cells isolated from explanted scaffolds and stained for the DC markers, CD11c and CD86. Cells were isolated from blank and GM-CSF (3000 ng) loaded scaffolds implanted for 28 days. Numbers in FACS plots indicate the percentage of the cell population positive for both markers. D) The fractional increase in CD11c(+)CD86(+) DCs isolated from PLG scaffolds at day 14 after implantation in response to doses of 1000, 3000 and 7000ng of GM-CSF, as normalized to the blank control (Blanks). (E) The in vivo concentration profiles of GM-CSF at the implant site of PLG scaffolds incorporating 0 (-), 3000 (--○--), and 7000 ng (--●--) of GM-CSF as a function of time post implantation. (F) The percentage of CD11c(+)CCR7(+) host DCs isolated from scaffolds loaded with 0 (□), 400 (■), 3000ng (■), and 7000 ng of GM-CSF (formula image
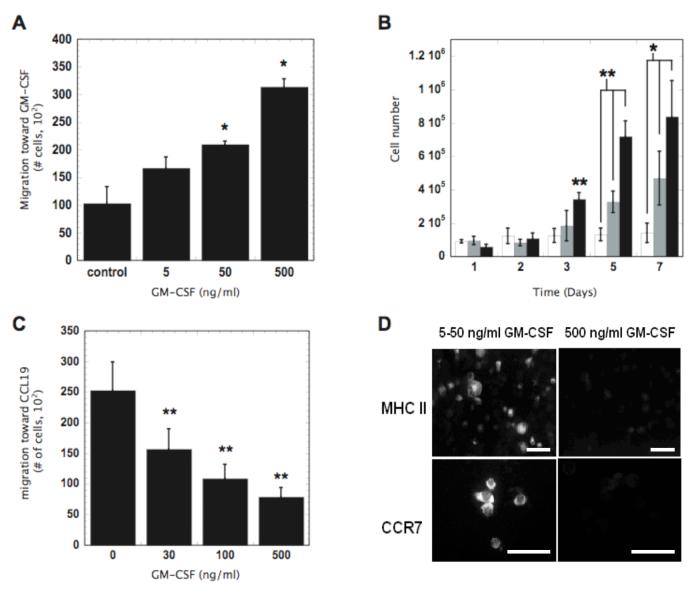
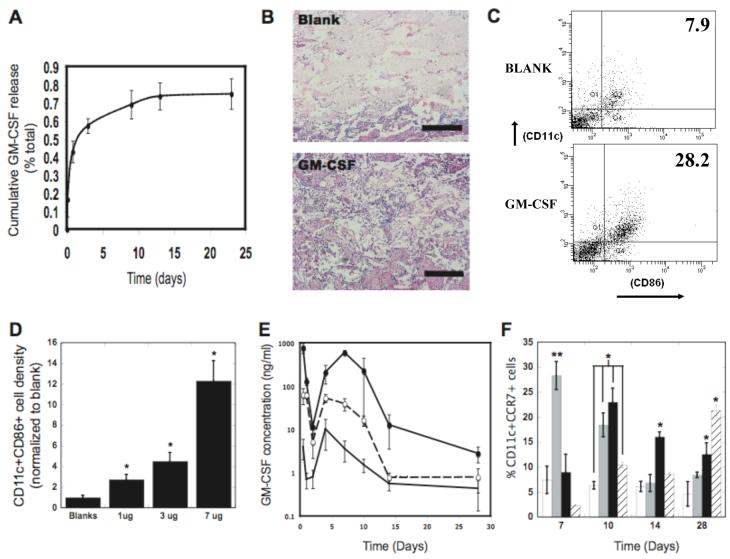
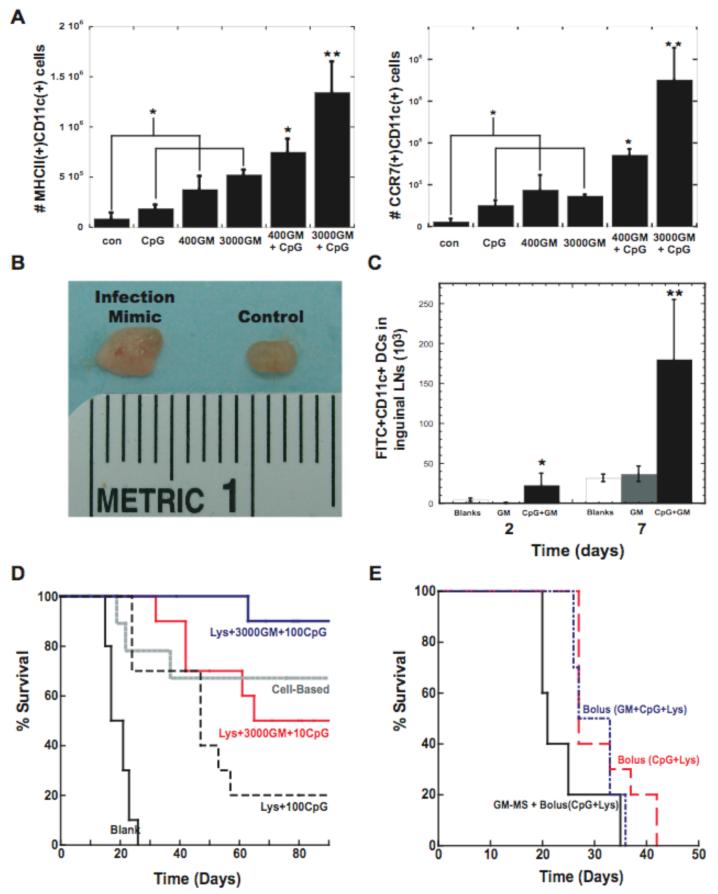
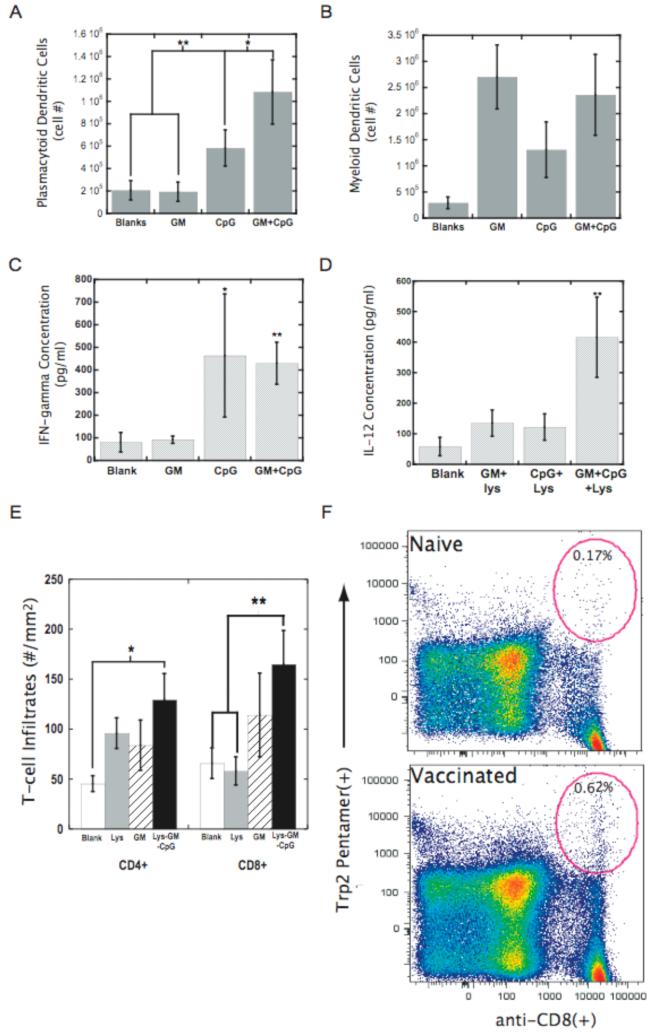
) as a function of time after implantation into the backs of C57BL/6J mice. Scale bar in B — 500 μm. Values in A, D, E, and F represent mean and standard deviation (n=4 or 5). * P<0.05 ** P<0.01.
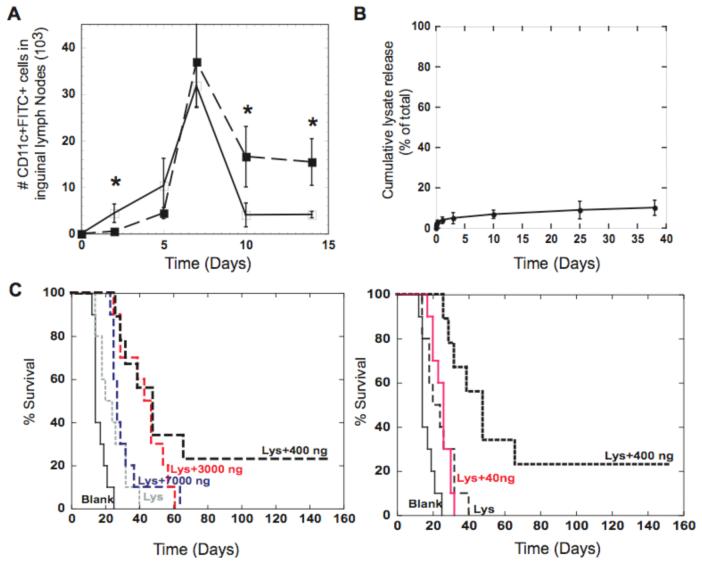
Figure 3
Figure 3. Batches of DCs programmed in situ infer anti-tumor immunity
(A) The number of FITC(+) DCs that had homed to the inguinal lymph nodes as a function of time subsequent to their residence at FITC painted blank scaffolds (-□-) and FITC painted GM-CSF loaded (3000 ng) scaffolds (-■-). (B) Cumulative release of tumor lysates (--■--) delivered from PLG Scaffolds (85:15, 120kD) demonstrates that tumor antigens are immobilized within the scaffold. (C) The survival time after PLG cancer vaccines were implanted into mice to appropriately expose host DCs to B16-F10 tumor lysates and 40, 400, 3000, and 7000 ng of GM-CSF. At Day 14 after vaccination, C57BL/6J mice were challenged with 105 B16-F10 melanoma tumor cells and monitored for animal survival. Day 0 on survival curves represents the day of tumor challenge. Values represent the mean and standard deviation (A, B; n=4 or 5) (C; n=9 or 10). * P<0.05** P<0.01.
Figure 4
Figure 4. Infection-mimicking microenvironment confers potent anti-tumor immunity
(A) The number of CD11c(+)MHCII(+) and CD11c(+)CCR7(+) host DCs isolated from matrices loaded with PEI-ODN control, 10 μg PEI-CpG-ODN, 400 and 3000ng GM-CSF, and 400 and 3000ng GM-CSF in combination with 10 μg PEI-CpG-ODN at Day 7 after implantation. (B) Digital photograph of inguinal lymph nodes from normal mice (control) and after 10 days implantation of matrices incorporating 10 μg CpG-ODN + 3000ng GM-CSF (infection-mimic). (C) The number of FITC(+)CD11c(+) DCs present in the inguinal lymph nodes at 2 and 7 days after implantation of FITC painted matrices [control (Blanks), GM-CSF loaded matrices (GM), GM-CSF and CpG-ODN matrices(CpG-GM)]. (D) A comparison of the survival time in mice treated with blank PLG scaffolds, antigen+100μg CpG-ODN (Lys+100CpG), antigen+3000ng GM-CSF+10μg CpG-ODN (Lys+3000GM+10CpG), and antigen+3000ng GM-CSF+ 100μg CpG-ODN (Lys+3000GM+100CpG). Animals were also immunized using a cell-based vaccine (cell-based). (E) The survival time of mice vaccinated with bolus injections of CpG-ODN+antigen (Bolus(CpG+Lys)), bolus injections of CpG-ODN, antigen, and GM-CSF (Bolus(GM+CpG+Lys)) or with PLG microspheres releasing GM-CSF combined with injection of CpG-ODN and antigen [GM-CSF+Bolus(CpG+Lys)]. Mice were challenged (Day 0 on graphs) with 105 B16-F10 melanoma tumor cells and monitored for the onset of tumor occurrence. GM-CSF dose was 3000ng and CpG-ODN dose was 10μg. Values represent the mean and standard deviation (A, C; n=3 or 4) (D,E; n=9 or 10). * P<0.05** P<0.01.
Figure 5
Figure 5. Infection mimics amplify TH1 induction and promote antigen specification during immune responses
The number of plasmacytoid DCs (CD11c+PDCA-1+) (A) and myeloid DCs (CD11c+CD11b+) (B) isolated from blank matrices (Blanks) or matrices loaded with either 3000ng of GM-CSF (GM) or 100 μg PEI-CpG-ODN (CpG) or the combination of GM-CSF and PEI-CpG-ODN (GM+CpG) at Day 7 after implantation. The in vivo concentrations of (C) IFN-γ and (D) IL-12 at the implant site of blank matrices (Blanks) or matrices loaded with either 3000ng of GM-CSF (GM) or 100 μg PEI-CpG-ODN (CpG) or the combination of GM-CSF and PEI-CpG-ODN (GM+CpG) at Day 7 after implantation into the backs of C57BL/6J mice. For IL-12 analysis all conditions also contained antigen (+Lys). (E) T cell infiltrates into tumors of animals treated with blank PLG scaffolds (□), PLG scaffolds incorporating tumor lysates (Lys), lysates+3000ng GM-CSF (GM), or lysates+3000ng GM-CSF+10 μg CpG-ODN (Lys+GM+CpG). (F) Splenocytes from naïve mice (naïve) and mice treated with PLG vaccines (vaccinated) were stained with anti-CD8-FITC Ab, anti-TCR -APC Ab, and Kb/TRP2 pentamers. The ellipitical gates in the upper right quadrant represent the TRP2-specific, CD8(+) T cells and numbers provide percentage of positive cells. Values in A-E represent the mean and standard deviation (n=4 or 5). * P<0.05** P<0.01.

References

    1. Banchereau J, Steinman RM. Taking dendritic cells into medicine. Nature. 2007;49:419–426. - PubMed
    1. Gilboa E. Dendritic cell based vaccines. J Clin Invest. 2007;117:1195–1203. - PMC - PubMed
    1. Banchereau J, Steinman RM. Dendritic cells and the control of immunity. Nature. 1998;392 - PubMed
    1. Schuler G, Schuler-Thurner B, Steinman RM. The use of dendritic cells in cancer immunotherapy. Curr Opin Immunol. 2003;15:138–147. - PubMed
    1. U.S. National Institutes of Health 2007. http://clinicaltrials.gov - PubMed

Publication types

Substances