. 2009 Feb;41(2):168-77.
doi: 10.1038/ng.302. Epub 2009 Jan 11.

Increased LIS1 expression affects human and mouse brain development

Affiliations

Increased LIS1 expression affects human and mouse brain development

Weimin Bi et al. Nat Genet. 2009 Feb.

Abstract

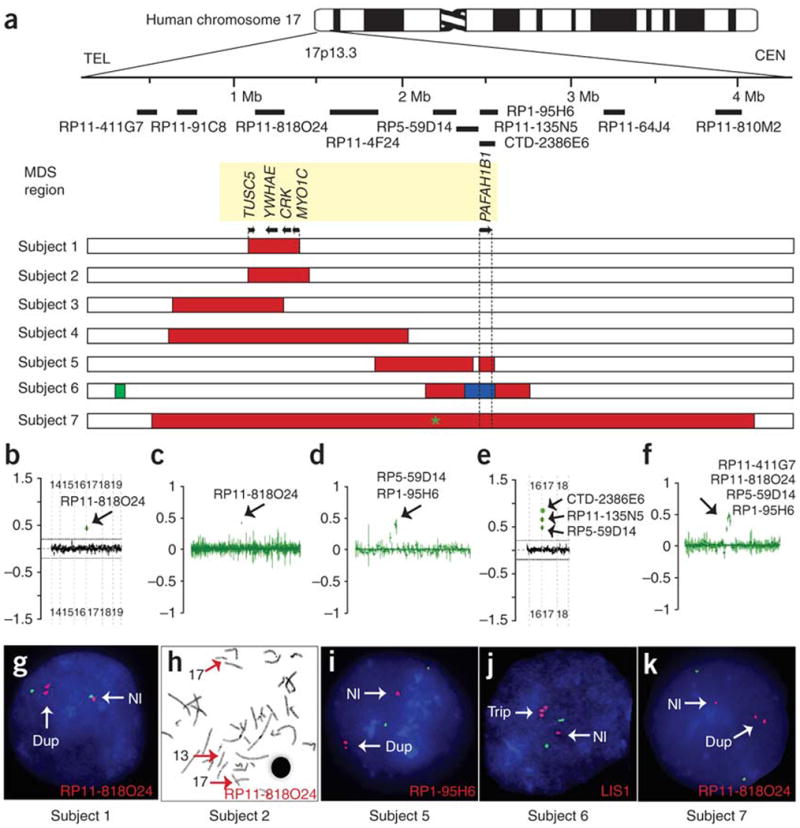
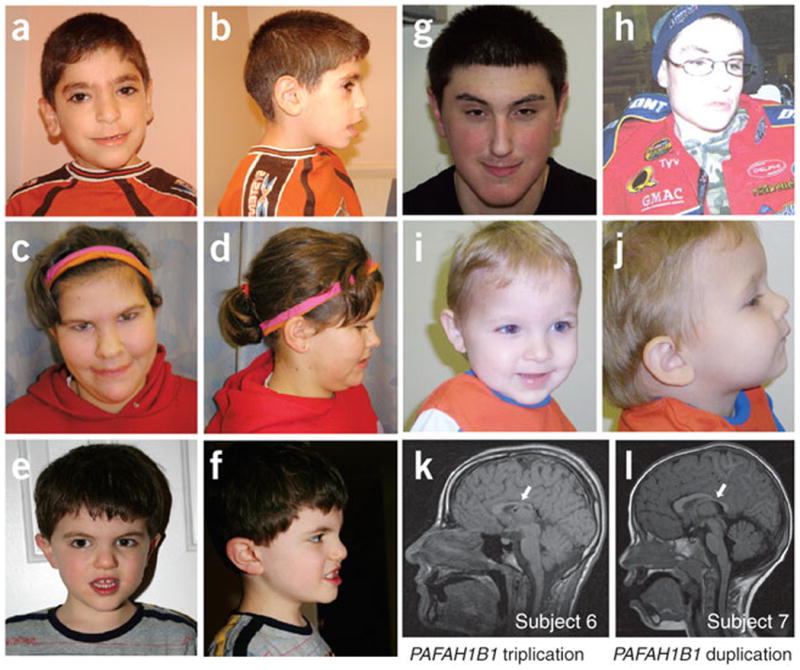
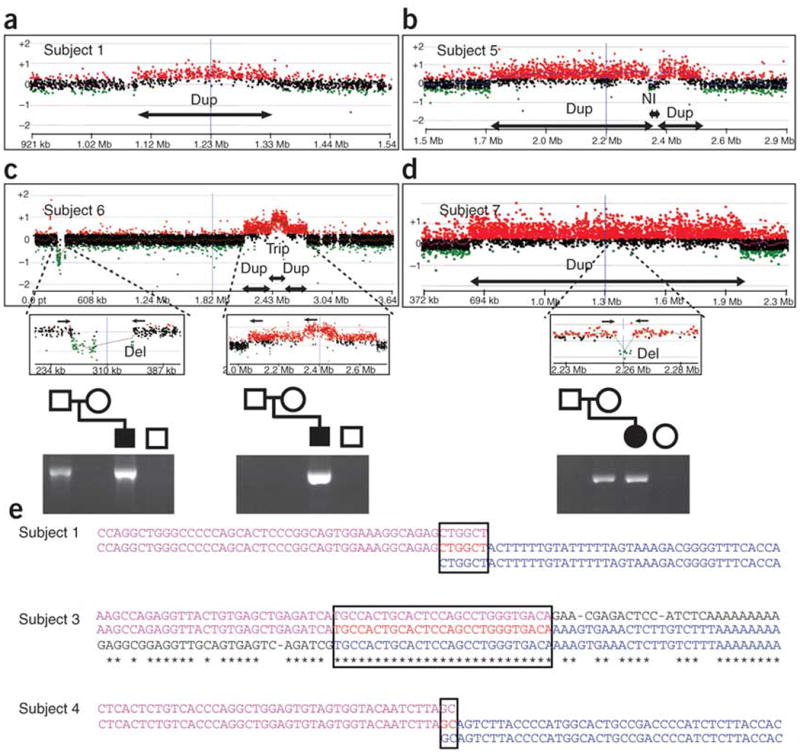
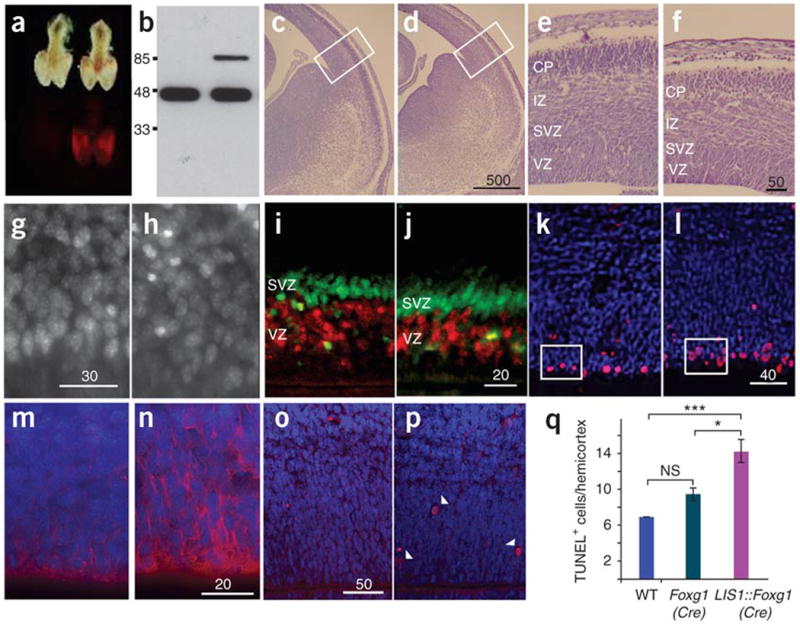
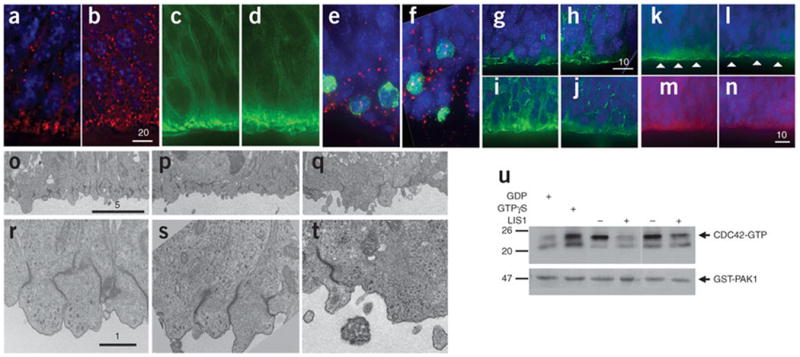
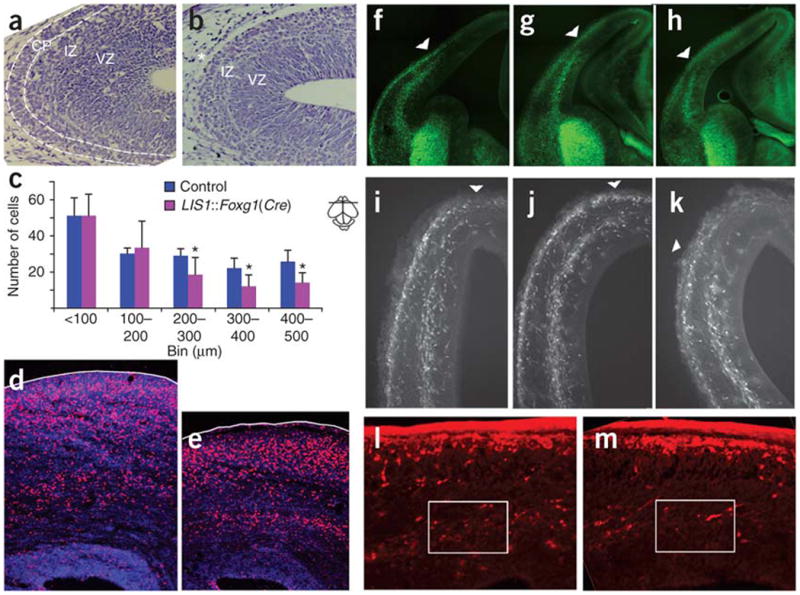
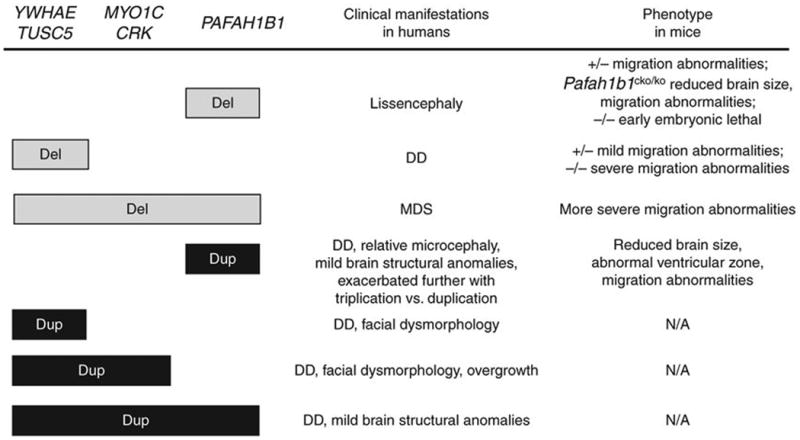
Deletions of the PAFAH1B1 gene (encoding LIS1) in 17p13.3 result in isolated lissencephaly sequence, and extended deletions including the YWHAE gene (encoding 14-3-3epsilon) cause Miller-Dieker syndrome. We identified seven unrelated individuals with submicroscopic duplication in 17p13.3 involving the PAFAH1B1 and/or YWHAE genes, and using a 'reverse genomics' approach, characterized the clinical consequences of these duplications. Increased PAFAH1B1 dosage causes mild brain structural abnormalities, moderate to severe developmental delay and failure to thrive. Duplication of YWHAE and surrounding genes increases the risk for macrosomia, mild developmental delay and pervasive developmental disorder, and results in shared facial dysmorphologies. Transgenic mice conditionally overexpressing LIS1 in the developing brain showed a decrease in brain size, an increase in apoptotic cells and a distorted cellular organization in the ventricular zone, including reduced cellular polarity but preserved cortical cell layer identity. Collectively, our results show that an increase in LIS1 expression in the developing brain results in brain abnormalities in mice and humans.


Figures

Figure 1
Figure 1
Seven individuals with duplications of the MDS region identified by array CGH. (a) Duplicated regions in 17p13.3. Top, ideogram of human chromosome 17. Clones used in the array analyses are shown. Bottom, MDS region is indicated by yellow box. Below are seven horizontal bars showing fine-mapping of duplications. Red, duplication; green, deletion; blue, triplication. Subject 1 had the smallest duplication, containing only four genes (TUSC5, YWHAE (encoding 14-3-3ε), CRK and MYO1C), with the first exon of some MYO1C transcripts outside the duplicated region. An 82-kb deletion in the subtelomeric region distal to the MDS region was identified in subject 6. Green asterisk for subject 7 indicates ∼4-kb deletion. TEL, telomere; CEN, centromere. (b–k) Gain of copy number (black arrows) in the MDS region was detected by array CGH (b–f) and confirmed by FISH (g–k). Clones with gain in copy number and probes for FISH are indicated. (h) Metaphase FISH analysis showing that the additional copy in 17p13.3 in subject 2 was inserted within the long arm of chromosome 13 (FISH signals indicated by red arrows). (j) Triplication in subject 6 was detected using a probe specific to PAFAH1B1 (encoding LIS1). Nl, normal; Dup, duplication; Trip, triplication.
Figure 2
Figure 2
Facial features and mild brain structural anomalies identified by brain MRI. (a,b) Subject 1 had thick eyebrows, synophrys, full periorbital region, long straight eyelashes, large ears with thick fleshy earlobes, squared nose with overhanging columella and thin upper lip. (c,d) Subject 2 had broad forehead, upslanting palpebral fissures, wide nasal bridge, synophrys, squared nasal tip, thin upper lip and prominent chin. (e,f) Subject 3 had mild facial anatomic abnormalities, including prominent and wide nasal bridge, mildly deep-set eyes, prominent eyebrows and mild prognathia. (g) Subject 4 had a long face, mild synophrys, mild hypotelorism, upslanting palpebral fissures, prominent nasal bridge, overhanging columella, short philtrum and thin upper lip. (h) Subject 6 had microcephaly and high rounded palate. (i,j) Subject 5 had microcephaly, prominent forehead, triangular face, mild jaw retraction and thin upper lip. Subjects 1–4 had a duplication of YWHAE, and subjects 5 and 6 had a duplication or triplication of PAFAH1B1, respectively. (k) Sagittal view of unenhanced T1-weighted brain MRI of subject 6 showing reduced brain size, mainly in the occipital cortex, and gross dysgenesis of the corpus callosum (arrow) especially affecting the splenium. (l) Sagittal view of T1-weighted brain MRI of subject 7 showing reduced brain size, mainly in the occipital cortex, thinning of the splenium of the corpus callosum (arrow) and very mild cerebellar volume loss. We obtained informed consent to publish these photographs.
Figure 3
Figure 3
Rearrangement mechanisms revealed by high-density array CGH and junction sequences. (a–d) The region and size of chromosome aberrations were precisely mapped by array CGH using a high-density customized array specific for chromosome 17p. As indicated by the arrows below the plots, subject 1 (a) had a simple small duplication, whereas subject 5 (b) showed a complex duplication-normal-duplication pattern, and subject 6 (c) showed a complex duplication-triplication-duplication pattern. An additional small deletion of ∼82 kb was identified ∼2 Mb distal to the MDS region in subject 6. Subject 7 (d) had a large duplication containing a small deletion of ∼4 kb. Shown below are PCR amplifications of the junction fragments using the primers indicated by the small arrows above. For subject 6, the complex rearrangement in the MDS region was de novo, but the distal deletion was inherited from the father. For subject 7, the deletion within the duplicated region was inherited from the mother. (e) Sequence analysis of the duplication junctions. Top (purple), normal distal flanking sequence; bottom (blue), normal proximal flanking sequence; middle, duplication junction sequence. Identical nucleotides between proximal and distal flanking sequences are indicated by asterisks. Regions of complete homology between proximal and distal sequences are boxed. Microhomology is present at the junctions between flanking sequences in subjects 1 (6 bp) and 4 (2 bp). Case 3 showed homologous recombination between the two AluSg elements within a perfect 27-bp homology interval.
Figure 4
Figure 4
LIS1-overexpressing mice have smaller brains with a disorganized ventricular zone. (a) Transgene expression was observed in the telencephalon of E12.5 LIS1-overexpressing mice (right) but not in Cre-control littermates (left). (b) LIS1-DsRed (85 kDa) is estimated to be 20% of endogenous LIS1 (46 kDa). (c,d) Cresyl violet staining of comparable E14.5 brain sections from control (c) and LIS1-overexpressing (d) mice. Scale bar size is given in micrometers. (e,f) Higher magnification of boxed areas in c (e) and d (f), showing noticeable reduction of brain width in LIS1-overexpressing brain (f). VZ, ventricular zone; SVZ, subventricular zone; IZ, intermediate zone; CP, cortical plate. (g,h) Hoechst 33342 staining of E13.5 live brain sections from control (g) and LIS1-overexpressing (h) mice. Cells in h were less organized. (i,j) E14.5 control (i) and LIS1 overexpressing (j) brain sections labeled with short (30 min) BrdU (red), combined with Tbr2 immunostaining (green) to label the ventricular and subventricular zones. (k,l) Immunostaining for phosphorylated histone H3 (red) in control (k) and LIS1-overexpressing (l) E14.5 brain sections. Nuclei were stained with DAPI (blue). Boxed areas highlight difference in number and organization of mitotic cells between k and l.(m,n) Immunostaining for nestin (red) in control (m) and LIS1-overexpressing (n) E14.5 brain sections. Nuclei were labeled with DAPI. Nestin expression was higher in LIS1-overexpressing mice. (o,p) Detection of apoptotic (TUNEL-positive) cells (red) indicated by arrowheads in control (o) and LIS1-overexpressing (p) mice. Nuclei were labeled with DAPI. (q) Quantification of TUNEL-positive cells in E14.5 coronal slices (20 mm thick) in Cre-control (Foxg1(Cre)) and LIS1-overexpressing (LIS1::Foxg1(Cre)) brains. ***P < 0.001, *P < 0.05.
Figure 5
Figure 5
LIS1-overexpressing mice show reduced cell polarity in the ventricular zone. (a,b) Immunostaining for β-catenin (red) in E14.5 brain sections from control (a) and LIS1-overexpressing (b) mice. Nuclei were labeled with DAPI (blue). Scale bar size is given in micrometers. (c,d) Staining for phalloidin-FITC (green) in E14.5 brain sections from control (c) and LIS1-overexpressing (d) mice. Fewer dense patches were observed in d compared to c. (e,f) Immunostaining for pericentrin (red) and phosphorylated histone H3 (green) in E14.5 brain sections of control (e) and LIS1-overexpressing (f) mice. Nuclei were labeled with DAPI. Wider distribution of centrosomes was observed in f. (g,h) Immunostaining for Numb (green) in E14.5 brain sections from control (g) and LIS1-overexpressing (h) mice. Wider cytoplasmic distribution of Numb was observed in h. (i,j) Immunostaining for pan-cadherin (green) in E14.5 brain sections from control (i) and LIS1-overexpressing (j) mice. Lower cadherin expression was observed in the apical surface of j. (k–n) Immuno-fluorescence for aPKCλ (green), PAR6 (red) and nuclei (blue) in control (k,m) and LIS1-overexpressing (l,n) E14.5 brain sections. Arrowheads in k and l highlight discontinuity in aPKC immunostaining. PAR6 staining was markedly lower in n versus m. (o–t) Electron micrographs of E12.5 brain sections at two magnifications. (o,r) Control in which transgene was inserted without Cre. (p,s) Additional Cre control. (q,t) LIS1 overexpression. Disorganization and reduction in adherens junctions were observed at lower (q) and higher magnification (t) in LIS1-overexpressing brains. (u) Cdc42 activity, measured by pulling down GTP-bound form of Cdc42. Addition of GTPγS served as positive control; GDP served as negative control. Less Cdc42-GTP was detected in E15.5 LIS1-overexpressing brain lysates compared to control.
Figure 6
Figure 6
Radial and tangential migration is delayed in LIS1-overexpressing mice. (a,b) Cresyl violet staining of E14.5 brain sections detected cortical plate (CP) in control (a) but not LIS1-overexpressing (b) mice. IZ, intermediate zone; VZ, ventricular zone. (c) BrdU labeling at E13.5 and analysis at E15.5 (mean ± s.d.). A significant number of LIS1-overexpressing neurons in LIS1::Foxg1(Cre) mice did not reach more superficial areas of the cortex. Bins represent distance from the ventricle in micrometers. Bin 400–500, P = 0.012; bin 300–400, P = 0.027; bin 200–300, P = 0.043 by Student t test. n = 5. (d,e) BrdU labeling at E13.5 and analysis at P0. Brain sections were immunostained for BrdU (red) and cell nuclei (DAPI; blue). BrdU-labeled LIS1-overexpressing cells (e) reached fewer superficial positions than did control cells (d), and LIS1-overexpressing brain width was thinner. (f–m) Tangential migration was reduced in LIS1-overexpressing mice. (f–h) GAD67-GFP-labeled interneurons (green) analyzed at E12.5. Shorter migratory route was undertaken in LIS1-overexpressing brain section (h) compared to two controls, transgene without Cre (f) and Cre without transgene (g). (i–k) GAD67-GFP-labeled interneurons (white) analyzed at E14.5. Shorter migratory route was undertaken in LIS1-overexpressing brain section (k) versus transgene without Cre (i) and Cre control (j). The arrowheads in f–k indicate the dorsal edge of interneurons' tangential migratory stream in the pallium. (l,m) Reduced tangential migration detected by immunostaining for calbindin (red). Fewer cells were observed in boxed area for LIS1-overexpressing mice at P0 (m) compared to control mice (l).
Figure 7
Figure 7
Clinical manifestations observed in affected individuals with deletions or duplications of dosage-sensitive genes within the MDS region and comparable phenotypes in transgenic mice. We considered copy numbers of the two MDS crucial genes, PAFAH1B1 and YWHAE, as well as CRK and MYO1C. TUSC5 is also shown because its role in MDS and 17p13.3 duplication is still unknown. Phenotypes in Pafah1b1-mutant mice are dosage sensitive: heterozygous mice (∼45%) showed disorganization in the cortex, hippocampus and olfactory bulb; Pafah1b1cko/ko mice with further reduction (∼35%) showed defects analogous to human lissencephaly, such as disorganized cortical layers, microcephaly and cerebellar defects. Mild structural anomalies in individuals with PAFAH1B1 duplication include dysgenesis of the corpus callosum and mild volume loss in the cerebellum, occipital cortex and cerebrum. Del, deletion; Dup, duplication; DD, developmental delay; −/−, homozygous mutants; +/−, heterozygous mutants; N/A, not available.

References

    1. Lupski JR. Genomic rearrangements and sporadic disease. Nat Genet. 2007;39:S43–S47. - PubMed
    1. Reiner O, et al. Isolation of a Miller-Dieker lissencephaly gene containing G protein beta-subunit-like repeats. Nature. 1993;364:717–721. - PubMed
    1. Barkovich AJ, Kuzniecky RI, Jackson GD, Guerrini R, Dobyns WB. A developmental and genetic classification for malformations of cortical development. Neurology. 2005;65:1873–1887. - PubMed
    1. Harding B. In: Dysplasias of Cerebral Cortex and Epilepsy. Guerrini R, editor. Lippincott-Raven; Philadelphia: 1996. pp. 81–88.
    1. Kamiya A, et al. A schizophrenia-associated mutation of Drosoph. Inf. Serv.C1 perturbs cerebral cortex development. Nat Cell Biol. 2005;7:1167–1178. - PubMed

Publication types

MeSH terms

Substances