. 2009 Feb;10(2):149-57.
doi: 10.1038/ni.1695. Epub 2009 Jan 11.

Interleukin 7 signaling in dendritic cells regulates the homeostatic proliferation and niche size of CD4+ T cells

Affiliations

Interleukin 7 signaling in dendritic cells regulates the homeostatic proliferation and niche size of CD4+ T cells

Martin Guimond et al. Nat Immunol. 2009 Feb.

Abstract

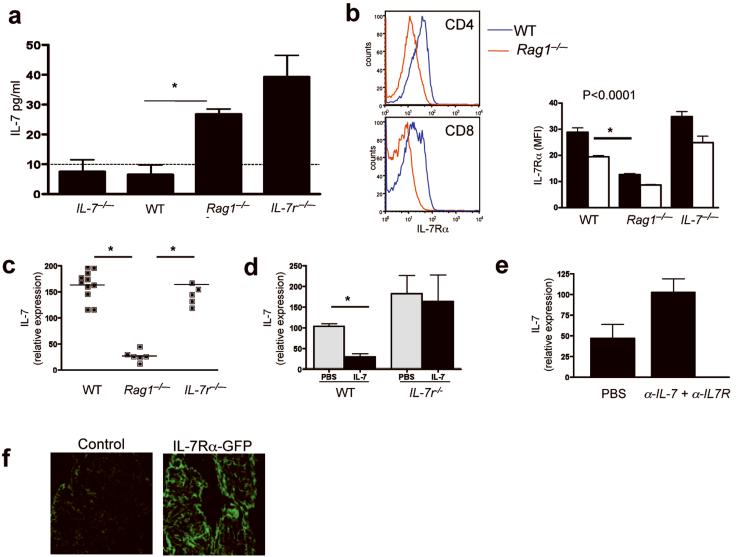
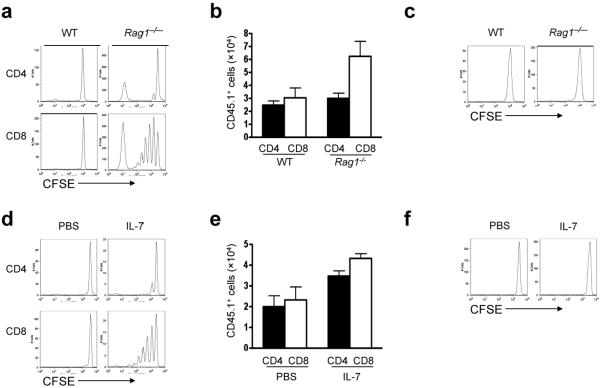
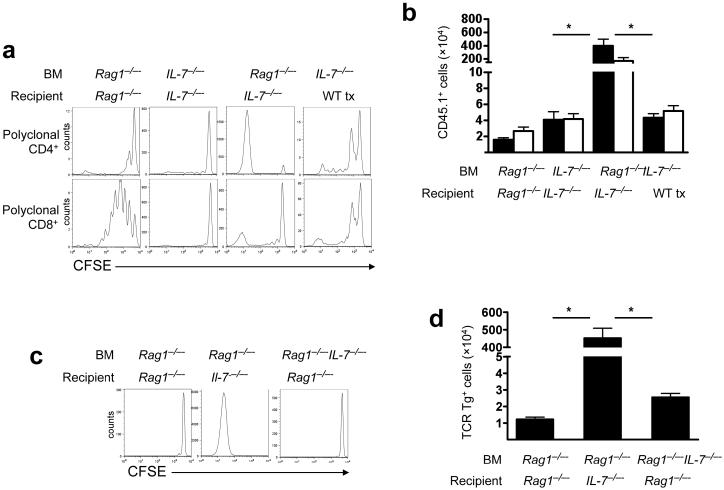
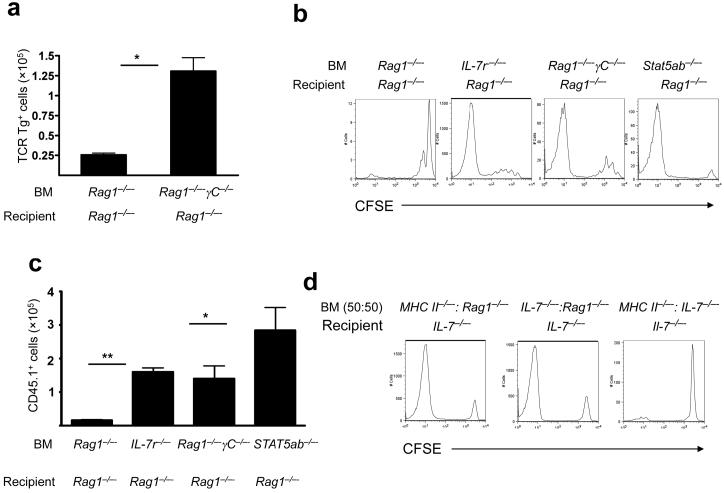
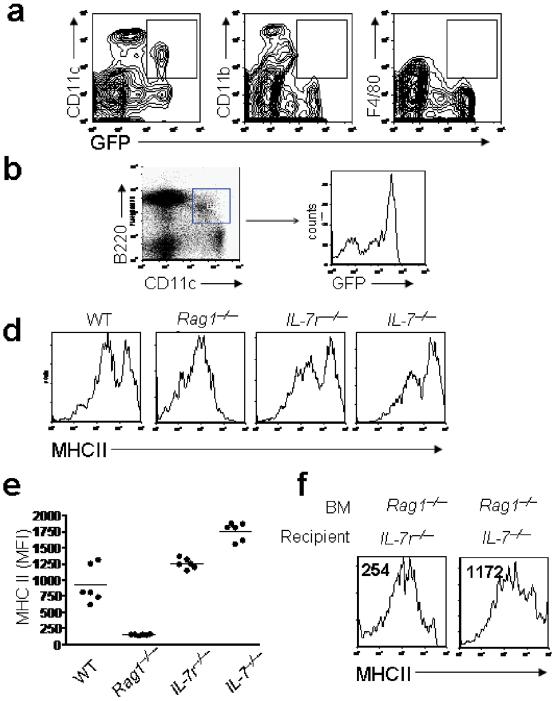
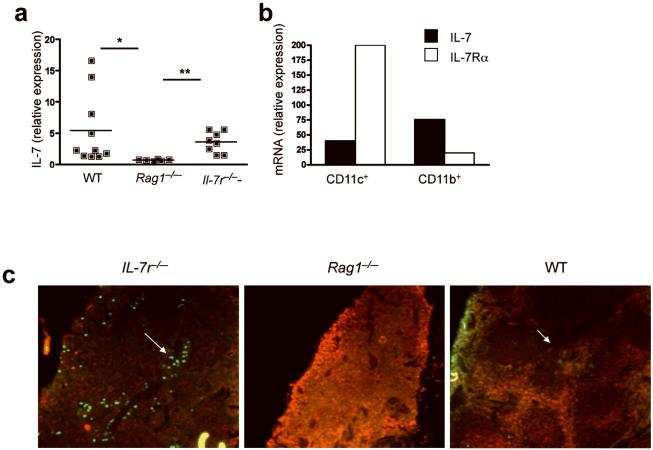
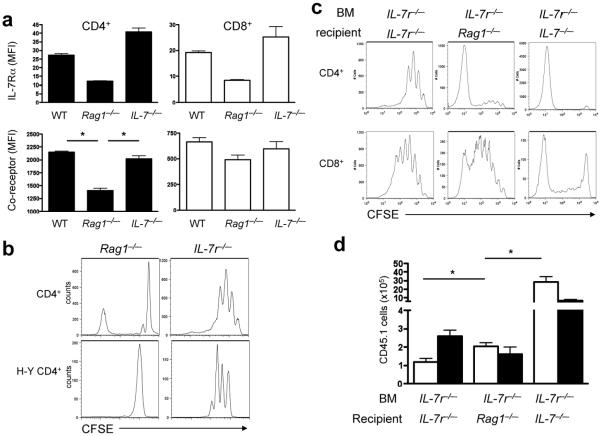
Interleukin 7 (IL-7) and T cell antigen receptor signals have been proposed to be the main drivers of homeostatic T cell proliferation. However, it is not known why CD4(+) T cells undergo less-efficient homeostatic proliferation than CD8(+) T cells do. Here we show that systemic IL-7 concentrations increased during lymphopenia because of diminished use of IL-7 but that IL-7 signaling on IL-7 receptor-alpha-positive (IL-7Ralpha(+)) dendritic cells (DCs) in lymphopenic settings paradoxically diminished the homeostatic proliferation of CD4(+) T cells. This effect was mediated at least in part by IL-7-mediated downregulation of the expression of major histocompatibility complex class II on IL-7Ralpha(+) DCs. Our results indicate that IL-7Ralpha(+) DCs are regulators of the peripheral CD4(+) T cell niche and that IL-7 signals in DCs prevent uncontrolled CD4(+) T cell population expansion in vivo.


Figures

Figure 1
Figure 1
IL-7Rα signaling regulates stromal IL-7 production in vivo. (a) IL-7 concentrations in serum (mean pg/ml of blood for triplicate wells) from indicated mice measured by 2E8 cell proliferation. Dashed line denotes limit of detection. *, P < 0.005 Blood was pooled from 4 mice, two independent experiments. (b) Left, IL-7Rα expression on congenic T cells 24 h after transfer into wild-type (WT) or Rag1-/- mice. Right, IL-7Rα MFI on congenic CD4 (black bars) and CD8 (white bars) T cells transferred into indicated recipients. *, P < 0.0001. Results are expressed as mean IL-7Rα (MFI), (n=4-5/group, 3 independent experiments). (c) IL-7 mRNA expression in splenic stroma of indicated mice, as measure by RT-PCR. Horizontal line indicates mean, and each dot represents an individual mouse. *, P < 0.0001. (d) Wild-type and Il7r-/- mice were treated with PBS or rhIL-7 (10μg/day) for 3 d (n=4/group), and IL-7 mRNA expression by the stroma was measured by RT-PCR. Data show mean ±s.e. of 4 mice/group, two independent experiments. *, P<0.0005. (e) Rag1-/- mice were treated with PBS or anti-IL-7 (M25) plus anti-IL-7Rα (A7R34) (1mg/day) for 3 d, and IL-7 mRNA expression by the stroma was measured by RT-PCR. Data show mean ±s.e. for 3 mice/group. (f) Fluorescence microscopy of the spleen capsule of wild-type mice (control) and mice expressing GFP downstream of the IL-7Rα promoter. Results are representative of two independent experiments. Two GFP transgenic mice and one WT control were analyzed in two independent experiments.
Figure 2
Figure 2
Elevated systemic IL-7 preferentially expands CD8+ but not CD4+ T cells. (a,b) CD45.1+ LN T cells were labeled with CFSE and transferred into CD45.2+ wild-type (WT) or Rag1-/- recipients. (a) CFSE dilution was analyzed 7 d later. Representative CFSE profile. (b) Numbers of CD8+CD45.1+ and CD4+CD45.1+ T cells recovered from the spleens of recipients 7 d post-transfer (n=6-8 mice per group). (c) As in (a), but using CFSE-labeled Marilyn CD4+ cells. Results are representative of three independent experiments. (d,e) Polyclonal CD45.1+ LN T cells were labeled with CFSE and transferred into CD45.2+ wild-type recipients treated with PBS or IL-7 (10μg/day). (d) CFSE dilution was analyzed 7 d post-transfer. Representative CFSE profile. (e) Numbers of CD45.1+CD8+ and CD45.1+CD4+ T cells recovered from the spleens of recipient mice (n=3-6 mice/group) (f) As in (d), but using CFSE-labeled Marilyn CD4+ cells. These results are representative of four independent experiments.
Figure 3
Figure 3
BM-derived IL-7 supports, whereas stromal cell-derived IL-7 inhibits, CD4+ T cell homeostatic proliferation in lymphopenic hosts. (a,b) CFSE-labeled CD45.1+ polyclonal wild-type T cells were transferred into the indicated BM chimeras. Tx, thymectomized. (a) Representative CFSE profile measured 7 d post-transfer. (b) Numbers of CD8+CD45.1+ and CD4+CD45.1+ T cells recovered from the spleens of recipients 7 d post-transfer. CD4 (black bars) and CD8 (white bars) Data represent mean±s.e. for each group (n=6-10 mice/group) *, P<0.0001. (c,d) As in (a,b), but using CFSE-labeled Marilyn CD4+ cells (n=6-8 mice/group). *, P<0.0001. These results are representative of two independent experiments.
Figure 4
Figure 4
IL-7 signaling on BM-derived cells inhibits CD4+ T cell homeostatic proliferation during lymphopenia. (a) Marilyn T cells were transferred into the indicated BM chimeras. On day +7 after lymphocyte transfer, Marilyn T cells recovered from the spleen were enumerated. Data show mean±s.e. (n=6 mice/group), results representative of three independent experiments. *, P<0.001. (b) CFSE-labeled wild-type CD4+CD45.1+ cells were transferred into indicated BM chimeras. Seven days post-transfer CFSE dilution was assessed (n=6-8 mice/group), results representative of two independent experiments. (c) Wild-type CD4+CD45.1+ cells were transferred into indicated BM chimeras. Seven days post-transfer donor cells recovered from the spleen were enumerated. Data show mean±s.e. (n=3-6 mice/group). *, P<0.05 and **, P<0.0001). (d) Lethally irradiated Il7-/- mice received a mixture of the indicated BM. Five weeks later, BM chimeras received CFSE-labeled wild-type CD45.1+ T cells and, 7 days later, CFSE dilution was analyzed, (n=6-10 mice/group, results representative of three independent experiments).
Figure 5
Figure 5
IL-7 Signaling diminishes MHCII expression on APCs during lymphopenia. (a,b) APCs from mice expressing GFP under the control of the IL-7Rα promoter were analyzed by flow cytometry. *, P< 0.05. (c) Left, CD11b+CD11c-, CD11b+CD11c+ and CD11b-CD11c+ splenocytes in indicated mice were enumerated. Data show mean±s.e. Right, MHCII expression was measured on the designated splenocyte subsets from representative Il7r-/- (red shaded), and Rag-/- (blue line) mice. (d,e) MHCII expression on plasmacytoid DCs from indicated mice. (d) Representative histograms gated on CD11b-CD11c+B220+ cells. (e) MFI of MHCII expression. (n=6 mice/group) (f) MHCII expression on plasmacytoid DCs from indicated BM chimeras. These results are representative of three independent experiments.
Figure 6
Figure 6
Stromal cell-derived IL-7 regulates DC IL-7 production within the lymphoid microenvironment. (a) IL-7 mRNA expression in splenocytes from indicated mice was measured by RT-PCR. Horizontal lines indicate mean, and each dot represents an individual mouse. 6 to 10 individual mice were analyzed and the experiment was done twice *, P<0.05 and **, P<0.005. (b) IL-7 and IL-7Rα mRNA expression in electronically sorted CD11b-CD11c+ and CD11b+CD11c- cells from pooled wild-type mice. Results are representative of 2 independent experiments. (c) IL-7 (green) and CD45 (red) expression in spleens of indicated mice, as measured by immunofluorescence. Results are representative of 2 independent experiments.
Figure 7
Figure 7
IL-7 acts directly on CD4+ T cells. (a) Polyclonal CD45.1+ T cells were transferred into indicated recipient mice. At day +7, lL-7Rα, CD4 and CD8 expression on CD45.1+ T cells was measured by flow cytometry. Data show mean±s.e. (n=3 mice/group), and the results are representative of two independent experiments. *, P<0.001. (b) CFSE-labeled polyclonal and naïve H-Y TCR transgenic CD4+ T cells were transferred into the indicated recipient mice. CFSE dilution was measured at day +7 ater adoptive transfers. transfer. (c,d) CFSE-labeled CD45.1+ T cells were transferred into the indicated BM chimeras. Seven days later, CFSE dilution was measured (c) and CD45.1+ T cells in the spleen were enumerated (d). Data in (d) show mean±s.e. (n=6-12/group). *, P<0.01 and **, P<0.001. These results are representative of 3 independent experiments.

Comment in

References

    1. Mackall CL, et al. Age, thymopoiesis, and CD4+ T-lymphocyte regeneration after intensive chemotherapy. N Engl J Med. 1995;332:143–9. - PubMed
    1. Heitger A, et al. Essential role of the thymus to reconstitute naive (CD45RA+) T-helper cells after human allogeneic bone marrow transplantation. Blood. 1997;90:850–7. - PubMed
    1. Dumont-Girard F, et al. Reconstitution of the T-cell compartment after bone marrow transplantation: restoration of the repertoire by thymic emigrants. Blood. 1998;92:4464–71. - PubMed
    1. Hakim FT, et al. Constraints on CD4 recovery postchemotherapy in adults: thymic insufficiency and apoptotic decline of expanded peripheral CD4 cells. Blood. 1997;90:3789–98. - PubMed
    1. Douek DC, et al. Evidence for increased T cell turnover and decreased thymic output in HIV infection. J Immunol. 2001;167:6663–8. - PubMed

Publication types

MeSH terms

Substances