. 2009 Feb;15(2):159-68.
doi: 10.1038/nm.1904. Epub 2009 Jan 11.

AdPLA ablation increases lipolysis and prevents obesity induced by high-fat feeding or leptin deficiency

Affiliations

AdPLA ablation increases lipolysis and prevents obesity induced by high-fat feeding or leptin deficiency

Kathy Jaworski et al. Nat Med. 2009 Feb.

Abstract

A main function of white adipose tissue is to release fatty acids from stored triacylglycerol for other tissues to use as an energy source. Whereas endocrine regulation of lipolysis has been extensively studied, autocrine and paracrine regulation is not well understood. Here we describe the role of the newly identified major adipocyte phospholipase A(2), AdPLA (encoded by Pla2g16, also called HREV107), in the regulation of lipolysis and adiposity. AdPLA-null mice have a markedly higher rate of lipolysis owing to increased cyclic AMP levels arising from the marked reduction in the amount of adipose prostaglandin E(2) that binds the Galpha(i)-coupled receptor, EP3. AdPLA-null mice have markedly reduced adipose tissue mass and triglyceride content but normal adipogenesis. They also have higher energy expenditure with increased fatty acid oxidation within adipocytes. AdPLA-deficient ob/ob mice remain hyperphagic but lean, with increased energy expenditure, yet have ectopic triglyceride storage and insulin resistance. AdPLA is a major regulator of adipocyte lipolysis and is crucial for the development of obesity.


Figures
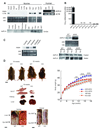
Figure 1
Figure 1
Adpla tissue distribution, regulation of expression, and body weights of Adpla null mice. (a) Top panel (left side): 10 µg of total RNA from various mouse tissues were analyzed by Northern blotting. SI (small intestine), SM (skeletal muscle), Epi (epididymal fat), Ing (inguinal fat), SVF (stromal vascular fraction), Ad.F (adipocyte fraction). Top panel (right side): RNA (2.5 µg) from human SM, liver, or WAT were analyzed by RT-PCR for expression of Adpla or β-actin. Bottom panel: Western blot analysis for AdPLA protein in various mouse tissues. 80 µg of protein was subjected to SDS-PAGE and probed with anti-AdPLA antibodies. Ren (renal fat). (b) RT-qPCR using RNA from wild-type (WT) renal WAT. Values for PLA2s were normalized to Gapdh and then expressed relative to cPLA2-α (n = 5). ND = not detected. (c) Left panel: Northern blot of Adpla mRNA in epididymal WAT from mice fasted for 48 h or fasted and refed for 12 h, or made diabetic by streptozotocin injection, with or without insulin replacement (n = 3). Right upper panel: Adpla mRNA expression in inguinal WAT from WT and ob/ob mice analyzed by Northern blotting (n = 3). Right lower panel: Western blotting for AdPLA in WAT depots from WT, db/db and ob/ob mice (n = 3). (d) Top left panel: Representative photographs of male WT and Adpla null (KO) mice at 18 and 32 wks of age. Scale bar = 15 mm. Top right panel: Body weights of male WT and KO on either a SD (n = 11), or a HFD (n = 24–33). Bottom left panels: Representative photographs of fat pads and organs of 18 wk-old male KO and WT littermates, ISc (interscapular). Scale bar left = 8 mm; Scale bar right = 10 mm. Results are means ± SEM, **P < 0.01, ***P < 0.001 versus WT.
Figure 2
Figure 2
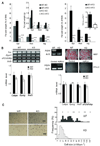
Adpla ablation causes a reduction in fat pad weight, TAG content, and adipocyte size, but does not affect adipocyte differentiation. (a) Left panel: Fat pad weights from male KO and WT littermates. Mice were fed a SD or a HFD until 18 wks of age (n = 6–16). Right panel: Fat pad weights of male KO and WT littermates on a HFD at 32 wks of age (n = 8). Inset: TAG content in epididymal WAT. (b) Left top panel: RT-PCR for genes involved in lipid metabolism, using RNA from epididymal WAT of male WT and KO (n = 5). Left bottom panel: RT-qPCR for adipocyte differentiation markers, using RNA from epididymal WAT of 18 wk-old male mice (n = 5). Upper right panels: MEF from WT and KO embryos were differentiated and harvested at d 12, or stained with Oil Red O. 3T3-L1 cells transfected with LacZ control vector or Adpla expression vector were also differentiated and stained for neutral lipid. Adpla mRNA levels were determined in cells by RT-PCR using Gapdh as a control. Right bottom panel: RT-qPCR of adipogenic markers using RNA from adipocytes differentiated from WT and KO MEF (n = 4). Scale bar = 6 mm. (c) Left panel: Paraffin-embedded sections of epididymal WAT from 18 wk-old male KO and WT mice fed a HFD were stained with hematoxylin and eosin. Scale bar top = 80 µm; Scale bar bottom = 20 µm. Right panel: Distribution of adipocyte size. Results are means ± SEM, *P < 0.05, **P < 0.01, ***P < 0.001 versus WT.
Figure 3
Figure 3
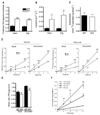
Adpla ablation increases lipolysis in vivo, ex vivo and in vitro. (a) Fractional in vivo synthesis of TAG-glycerol in gonadal (Gon) and inguinal (Ing) WAT of 24 wk old female mice on a HFD (n = 5–6). (b) In vivo lipolysis in Gon and Ing WAT from 24 wk old female mice on a HFD (n = 3–6). (c) 14C-palmitate esterification into TAG in WAT explants. (d) Basal and stimulated (+ 100 nM isoproterenol) lipolysis measured by glycerol (left panel) and fatty acids (right panel) released from explants of epididymal WAT from overnight fasted 16 wk old male WT and KO mice on a HFD (n = 5). (e) Molar ratio of FFA to glycerol release from WAT explants. (f) Basal and stimulated lipolysis as measured by fatty acids released from WT and KO MEF at d 12 after differentiation into adipocytes. MEF were incubated with or without isoproterenol at 200 nM (n = 6). Results are means ± SEM, *P < 0.05, **P < 0.01, ***P < 0.001.
Figure 4
Figure 4
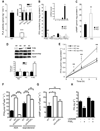
Adpla deficiency increases lipolysis by decreasing PGE2 levels and increasing cAMP levels. (a) Total PLA activity in epididymal WAT from 16 wk old male WT and KO mice fed a HFD (n = 3). Inset: PLA2 expression in WAT. (b) PG content in epididymal WAT of 18 wk old male WT and KO mice on a HFD (n = 5). Inset: RT-qPCR of PG receptors normalized to Actb, in WAT of WT mice (n = 5). (c) cAMP in epididymal WAT from male WT and KO mice on a HFD (n = 5). (d) Immunoblot of phosphorylated Hsl (P-Hsl), Hsl, desnutrin/Atgl and Gapdh (control) with relative quantification. (e) Stimulated lipolysis measured by fatty acid release from WT and KO MEF on d 12 after differentiation into adipocytes. MEF were incubated with 200 nM isoproterenol and 100 nM PGE2 as indicated (n = 6). (f) Lipolysis in isolated adipocytes from KO or WT mice incubated with 1 U ml−1 adenosine deaminase (ADA) or isoproterenol (200 nM) and treated with or without 10 nM PGE2. (g) cAMP levels in isolated adipocytes from WT or Adpla null mice treated with or without 10 nM PGE2 (ns = not significantly different). (h) Lipolysis in isolated adipocytes treated with the EP3 antagonist L826266 (10 µM), with or without 10 nM PGE2. Results are means ± SEM, *P < 0.05, **P < 0.01, ***P < 0.001.
Figure 5
Figure 5
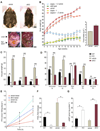
Adpla deficiency prevents obesity in ob/ob leptin deficient mice. (a) Top panel: Representative photographs of 16 wk old male ob/ob and dKO mice fed a SD. Scale bar = 8 mm. Bottom panel: representative photographs of their livers and epididymal WAT. Scale bar = 6 mm. (b) Left panel: Body weights of female mice on a SD. Right panel: Food intake in 12 wk old male mice fed a SD. (c) Comparison of weights of WAT depots from WT, KO, ob/ob and dKO mice. (d) Carcass analysis of 40 wk old male mice fed a HFD. (e) Basal and stimulated lipolysis measured by fatty acid release from explants of epididymal WAT in 12 wk old male ob/ob and dKO mice fed a HFD. (f) PGE2 and (g) cAMP levels in WAT of 12 wk old male WT, KO, ob/ob and dKO mice fed a HFD. Results are means ± SEM, *P < 0.05, **P < 0.01, ***P < 0.001.
Figure 6
Figure 6
Adpla deficiency impairs glycemic control, increases energy expenditure and promotes fatty acid oxidation in WAT. (a) Glucose (GTT) and insulin (ITT) tolerance tests in 18 wk old male WT and KO mice fed a HFD (n = 7). (b) GTT and ITT in 14 wk old male ob/ob and dKO mice fed a HFD (n = 8–9). (c–g) Results from hyperinsulinemic euglycemic clamp performed in 12 wk old male WT and KO mice fed a HFD (n = 4–5). (c) Average glucose infusion rate (GINF) and (d) whole body glucose uptake. (e) Hepatic glucose production (HGP) under basal and clamp conditions. (f) Glucose uptake by skeletal muscle (gastrocnemius). (g) Total glucose uptake and glucose uptake per gram of tissue (inset) in epididymal WAT. (h) Oxygen consumption rate (VO2) determined via indirect calorimetry during the light (7am – 7pm) and dark (7pm – 7am) period in 18 wk old male KO and WT mice on a SD (n = 3–6). (i) RT-qPCR for Ucp-1 Dio2 and Ppard, using RNA from epididymal fat from 20 wk old male WT and KO mice fed a SD (n = 3–4). (j) Oxidation of [U-14C]palmitate to 14CO2 by adipocytes isolated from WT, KO, ob/ob and dKO mice (n = 3). Results are means ± SEM, *P < 0.05, **P < 0.01, ***P < 0.001.

References

    1. Duncan RE, Ahmadian M, Jaworski K, Sarkadi-Nagy E, Sul HS. Regulation of lipolysis in adipocytes. Annu Rev Nutr. 2007;27:79–101. - PMC - PubMed
    1. Gregoire FM, Smas CM, Sul HS. Understanding adipocyte differentiation. Physiol Rev. 1998;78:783–809. - PubMed
    1. Jaworski K, Sarkadi-Nagy E, Duncan RE, Ahmadian M, Sul HS. Regulation of triglyceride metabolism. IV. Hormonal regulation of lipolysis in adipose tissue. Am J Physiol Gastrointest Liver Physiol. 2007;293:G1–G4. - PMC - PubMed
    1. Dircks L SH. Acyltransferases of de novo glycerophospholipid biosynthesis. Prog Lipid Res. 1999;38:461–479. - PubMed
    1. Yet SF LS, Hahm YT, Sul HS. Expression and identification of p90 as the murine mitochondrial glycerol-3-phosphate acyltransferase. J Biochem. 1993:9486–9491. - PubMed

Publication types

Associated data