Review
. 2008 Dec;32 Suppl 7(Suppl 7):S98-108.
doi: 10.1038/ijo.2008.245.

Molecular physiology of weight regulation in mice and humans

Affiliations
Review

Molecular physiology of weight regulation in mice and humans

R L Leibel. Int J Obes (Lond). 2008 Dec.

Abstract

Evolutionary considerations relating to efficiency in reproduction, and survival in hostile environments, suggest that body energy stores are sensed and actively regulated, with stronger physiological and behavioral responses to loss than gain of stored energy. Many physiological studies support this inference, and suggest that a critical axis runs between body fat and the hypothalamus. The molecular cloning of leptin and its receptor-projects based explicitly on the search for elements in this axis-confirmed the existence of this axis and provided important tools with which to understand its molecular physiology. Demonstration of the importance of this soma-brain reciprocal connection in body weight regulation in humans has been pursued using both classical genetic approaches and studies of physiological responses to experimental weight perturbation. This paper reviews the history of the rationale and methodology of the cloning of leptin (Lep) and the leptin receptor (Lepr), and describes some of the clinical investigation characterizing this axis.


Conflict of interest statement

Conflict of interest

The author has declared no financial interests.

Figures
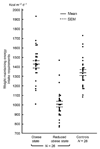
Figure 1
Figure 1
Weight-maintaining energy requirements in weight-reduced human subjects. Weight-maintaining energy intake requirements (kcalm−2 d−1) in 26 patients studied when obese and after substantial weight loss (reduced-obese state) in comparison to the requirements of 26 never-obese normal weight controls. In all instances except one, in which there was no change, per square meter energy requirements declined with weight loss.
Figure 2
Figure 2
ob/ob mouse with sibling.
Figure 3
Figure 3
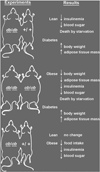
Schematic of effects on body weight and diabetes-related phenotypes of parabiosis of ob, db and +/+ mice. From these studies Coleman inferred that it ob might encode a secreted molecule, for which db was the receptor. Molecular cloning proved him right. Ob is leptin (LEP), db is the leptin receptor (LEPR).
Figure 4
Figure 4
db/db mouse with fa/fa rat. These mutations were genetically mapped to homologous intervals of the mouse and rat genome and the correspondence subsequently proved by physical mapping.,,
Figure 5
Figure 5
Effects of experimental weight perturbation in human subjects studied at −10 and −20% below customary body weight. Each subject was studied at Wt initial (usual), at −10% and, in some instances, −20% as well. Summary bar graphs include obese and lean, male and female subjects. There are no differences in the direction or magnitude of changes—normalized to lean (metabolic) mass—that occur in these groups. There are small changes in resting metabolic rate, but the most significant changes are in NREE, in this setting predominantly the energy cost of low levels of physical activity in sedentary lifestyle. Note that loss of 10% body weight provokes maximal decline in energy expenditure, consistent with the ‘threshold’ model described in the paper. All subjects were studied at Wt initial and at least one, other weight plateau. The figure is based on the data in Leibel et al. and Rosenbaum et al. NREE, non-resting energy expenditure; REE, resting energy expenditure; TEF, thermic effect of food.
Figure 6
Figure 6
Energy expenditure phenotypes—including skeletal muscle work efficiency—in weight-reduced human subjects. Percentage change (mean ± s.e.m.) from values of energy expenditure, skeletal muscle work efficiency and fuel utilization at initial body weight. Administration of leptin to weight-reduced subjects reversed the significant decline in TEE and NREE associated with maintenance of a 10% reduced body weight. Effects of weight loss and exogenous leptin on skeletal muscle gross mechanical work efficiency (kcal min−1 energy expended above resting per kcal min−1 of work generated) and fuel utilization (derived from RQ) were only evident at low levels of work (peddling to generate 10W of power). *P<0.05 versus 0; P<0.05 versus Wt–10%. GME, gross mechanical efficiency; NREE, non-resting energy expenditure; REE, resting energy expenditure; TEE, total energy expenditure.
Figure 7
Figure 7
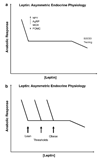
(a) Unlike dose–response characteristics of many hormones, leptin at high concentrations has little effect, whereas concentrations below a minimum ‘threshold’ invoke dramatic changes in hypothalamic neuropeptides and behaviors/metabolic phenotypes related to energy homeostasis. In this regard, the physiology is similar to that for blood glucose: high concentrations do not provoke a behavioral response, whereas low concentrations trigger powerful endocrine, autonomic and behavioral reactions. This threshold presumably has neuroanatomic and molecular ‘substrates’ that are, in turn, determined by genetic, developmental and environmental factors. Hence, as shown in (b), the concentration of ambient leptin (surrogate for fat mass) below which the threshold response is activated varies among individuals, accounting for the apparent ‘defense’ of different levels of adiposity. It is possible that this threshold may be changed by neuroanatomic consequences of chronically elevated circulating leptin (or insulin, ghrelin and so on) concentrations (see Figure 8).
Figure 8
Figure 8
Schematic of the linear relationship of plasma leptin concentration with body fat mass. A threshold (Figure 7) for leptin signaling is shown at the line labeled ‘initial’. This initial threshold is determined as per Figure 7. Here the effects of the VMH and LH lesions described earlier are shown as affecting the threshold for leptin action. Cachectic illness and anorexia nervosa are, in some ways, consistent with a lowering of the threshold. Aging, by neuronal loss, could move it upwards. Perhaps most importantly, persistent obesity itself, by virtue of the structural changes resulting in response to chronic elevations of leptin, insulin and so on, could move the threshold upwards so that a higher level of body fat is ‘defended’ metabolically and behaviorally. This possibility is alluded to in Figure 7a as ‘wiring’ effects at high concentrations of ambient leptin. VMH, ventromedial hypothalamus; LH, lateral hypothalamus.

References

    1. Chen P, Baas TJ, Mabry JW, Dekkers JC, Koehler KJ. Genetic parameters and trends for lean growth rate and its components in US Yorkshire, Duroc, Hampshire, and Landrace pigs. J Anim Sci. 2002;80:2062–2070. - PubMed
    1. Deeb N, Lamont SJ. Genetic architecture of growth and body composition in unique chicken populations. J Hered. 2002;93:107–118. - PubMed
    1. West DB, Boozer CN, Moody DL, Atkinson RL. Dietary obesity in nine inbred mouse strains. Am J Physiol. 1992;262:R1025–R1032. - PubMed
    1. Shadid S, Jensen MD. Nutrient partitioning. In: Bray GA, Bouchard C, editors. Handbook of Obesity. Etiology and Pathophysiology. 2nd edn. New York: Marcel Dekker; 2004. pp. 753–766.
    1. Bjorntorp P. Body fat distribution, insulin resistance, and metabolic diseases. Nutrition. 1997;13:795–803. - PubMed