. 2009 Mar 5;28(9):1274-9.
doi: 10.1038/onc.2008.466. Epub 2009 Jan 12.

MYC-induced myeloid leukemogenesis is accelerated by all six members of the antiapoptotic BCL family

Affiliations

MYC-induced myeloid leukemogenesis is accelerated by all six members of the antiapoptotic BCL family

L J Beverly et al. Oncogene. .

Abstract

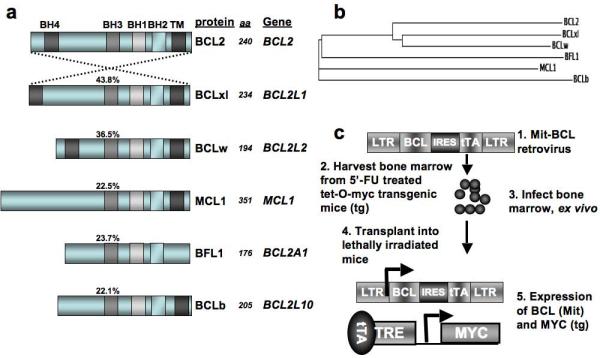
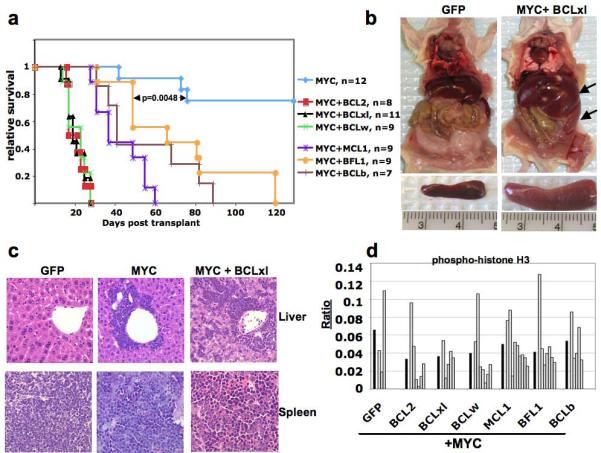
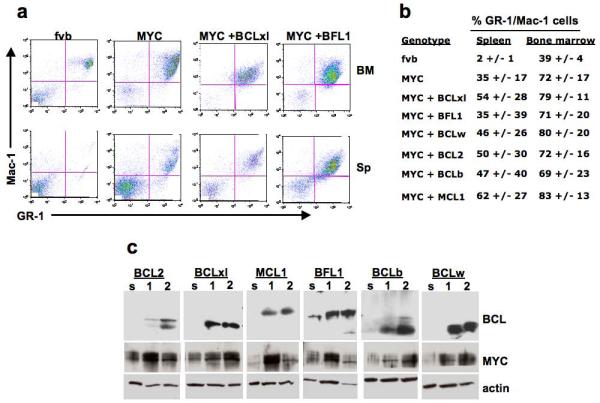
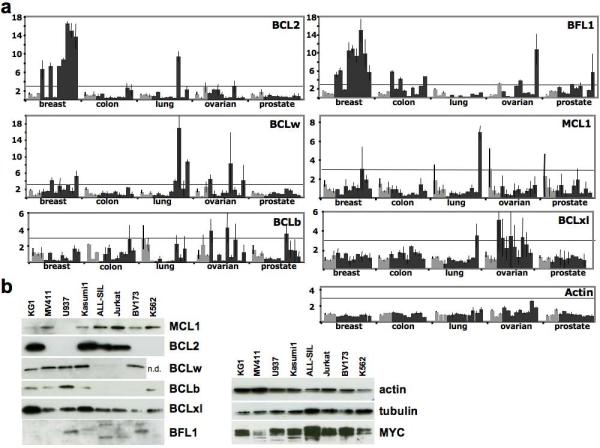
Signals that control the fine balance between cell death and cell survival are altered during tumorigenesis. Understanding the mechanisms by which this balance is perturbed, leading to excessive cell survival, is important for designing effective therapies. Proteins belonging to the B-cell lymphoma (BCL) family are known to regulate death responses to apoptotic signals, especially those originating within cells. A subset of BCL family members capable of inhibiting cell death is known to contribute to tumorigenesis; however, it is not known whether all six antiapoptotic BCL family members play a causal role in tumor development. Using a mouse model of MYC-driven leukemia, we showed that, in addition to the well characterized BCL2 and BCLxl (BCL2L1), the other four family members -- BCLw (BCL2L2), BCLb (BCL2L10), BFL1 (BCL2A1) and MCL1 -- also cooperate with MYC to accelerate leukemogenesis. In addition, high levels of each family member are found in either solid human tumors or cell lines derived from human leukemias or lymphomas.


Figures

Figure 1
Figure 1
BCL proteins and experimental design. (a) To show that anti-apoptotic BCL proteins encode related, but distinct proteins, sequences were entered into the “ALIGN” program and the amino acid sequence identity of each full-length protein was compared to the sequence of BCL2. The protein domains that were identified using the “SMART” algorithm are indicated with shaded boxes of similar color. The protein designations (protein) used in this work are indicated next to the schematics, along with number of amino acids (aa) encoded by each protein. The gene symbol (gene) is also given as a reference. (b) The “CLUSTALW” algorithm generates a phylogeny tree and the relative evolutionary distances between human BCL proteins are indicated by the relative lengths of the lines. (c) Experimental design for testing the in vivo potential of BCL genes to cooperate with MYC in tumorigenesis.
Figure 2
Figure 2
Induction of leukemia by cooperative action of MYC and BCL family members. (a) Kaplan-Meier survival curves are the compilation of two independent sets of bone marrow infections and transplantations performed as described in Figure 1c, and the number of mice for each cohort is indicated. MYC curve represents infections with a retrovirus encoding either tTA + GFP or tTA + luciferase. p-values were determined using student t-test for the values of the MYC + BFL1 cohort compared to the MYC cohort. (b) Regardless of the genotype of the leukemic cells mice had organomagly of spleen and liver (right panel, arrows), but did not display enlargement of lymph nodes or thymus. A mouse from the negative control cohort (mouse receiving Tet-O-MYC bone marrow cells infected with a retrovirus expressing only GFP) and a mouse with leukemia (mouse receiving Tet-O-MYC bone marrow cells infected with a retrovirus expressing BCLxl and tTA) are shown as representative examples. (c) Hematoxylin and eosin staining of liver and spleen from all leukemic mice, regardless of genotype, show infiltration of hematopoietic cells into liver and abnormal splenic cellularity. (d) For each paraffin embedded liver section, immuno-histochemistry was performed using an antibody that recognizes phosphorylated-histone H3, to identify cells in mitosis. Infiltrating leukemic cells from three random photographs were counted, and the total ratio of phospho-histone H3 positive cells for all tumors of a given genotype (dark bars) or the ratio of phospho-histone H3 positive cells for each individual tumor (open bars) was determined. Analysis of these ratios using a student t-test showed no statistically significant differences in the proliferation rates compared to MYC + GFP tumors.
Figure 3
Figure 3
MYC-induced leukemias resemble acute myelogenous leukemia regardless of cooperating BCL gene. (a) Cells from all mice that required euthanization were analyzed by flow cytometry to determine the phenotypic nature of the disease. All mice examined had significant increases in the percentage of cells that stained for the myeloid cell surface markers GR-1 and Mac-1. Flow cytometry profiles from the spleen (sp) and bone marrow (BM) of cells from syngeneic FVB mouse and three AML induced by either MYC alone, MYC + BCLxl or MYC + BFL1 are shown as representative examples. (b) A table indicating the average of the percentage, and the range of the percentage, of GR1+/Mac1+ cells within the tissues of each tumor genotype. (c) Western blots of extracts of two representative tumors of each genotype (labeled 1 and 2) and normal splenocytes (s). All BCL antibodies were raised against human antigens and likely have preference for detecting the human BCL proteins encoded by the proviruses. An antibody that recognizes both the endogenous mouse Myc and transgenic human MYC proteins was used to determine the levels of MYC protein; antibodies against beta-actin were used as a loading control.
Figure 4
Figure 4
BCL family members are expressed in human solid tumor samples and in leukemia/lymphoma cell lines. (a) Expression of BCL genes in human solid tumor samples. TissueScan oncology survey cDNA panels were obtained from OriGene (Rockville, MD, USA) and quantitative PCR analysis was performed (Sybr Green, Applied Biosystems, Foster City, CA, USA) using two independent oligo pairs for each BCL gene. The average level of mRNA in normal tissue samples (light bars) was used for each tissue type to determine the fold-change in expression of each sample (dark bars). The average of the fold-change between the two pairs of gene specific oligos was determined and the standard error of the mean is depicted. The horizontal line indicating a three-fold increase in relative expression serves as a reference. (b) Antibodies specific for each BCL family member were used for western blot analysis of whole cell lysates (1% CHAPS, 150 mM NaCl, 10 mM Hepes) from multiple leukemia/lymphoma cell lines.. An antibody against MYC was used to determine the levels of MYC protein, antibodies against beta-actin and tubulin were used as a loading control.

References

    1. Chen L, Willis SN, Wei A, Smith BJ, Fletcher JI, Hinds MG, et al. Differential targeting of prosurvival Bcl-2 proteins by their BH3-only ligands allows complementary apoptotic function. Mol Cell. 2005;17:393–403. - PubMed
    1. Chen S, Dai Y, Harada H, Dent P, Grant S. Mcl-1 down-regulation potentiates ABT-737 lethality by cooperatively inducing Bak activation and Bax translocation. Cancer Res. 2007;67:782–91. - PubMed
    1. Cory S, Huang DC, Adams JM. The Bcl-2 family: roles in cell survival and oncogenesis. Oncogene. 2003;22:8590–607. - PubMed
    1. Cosulich SC, Worrall V, Hedge PJ, Green S, Clarke PR. Regulation of apoptosis by BH3 domains in a cell-free system. Curr Biol. 1997;7:913–20. - PubMed
    1. Hemann MT, Bric A, Teruya-Feldstein J, Herbst A, Nilsson JA, Cordon-Cardo C, et al. Evasion of the p53 tumour surveillance network by tumour-derived MYC mutants. Nature. 2005;436:807–11. - PMC - PubMed

Publication types

Substances