. 2009;4(1):e4175.
doi: 10.1371/journal.pone.0004175. Epub 2009 Jan 12.

Studying early lethality of 45,XO (Turner's syndrome) embryos using human embryonic stem cells

Affiliations

Studying early lethality of 45,XO (Turner's syndrome) embryos using human embryonic stem cells

Achia Urbach et al. PLoS One. 2009.

Abstract

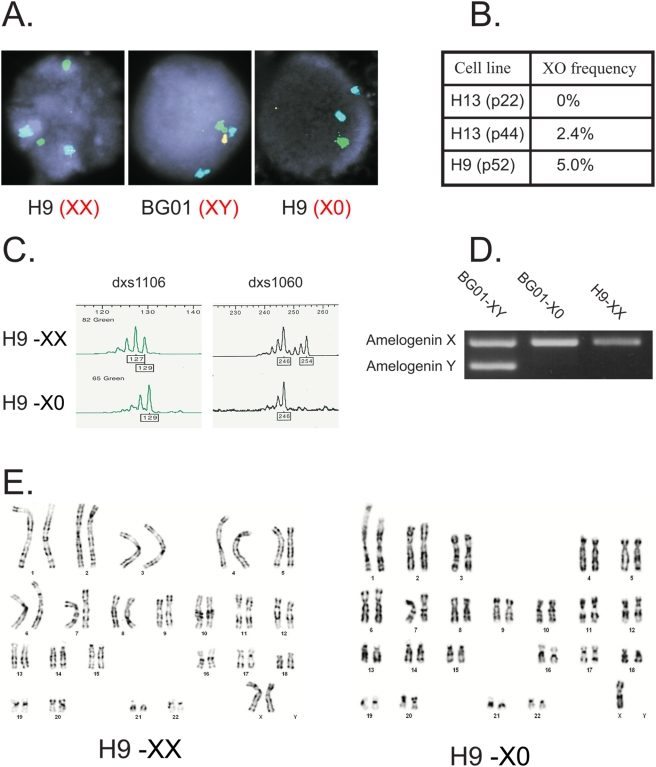
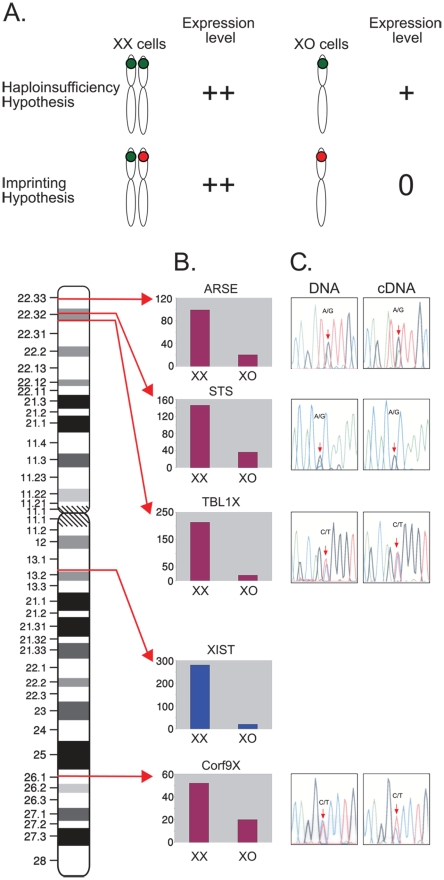
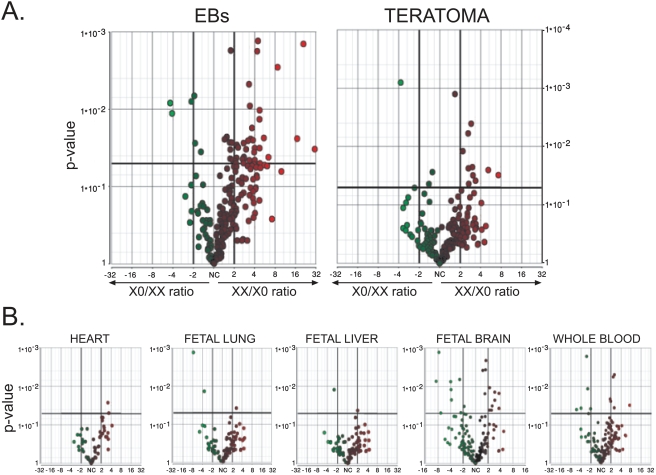
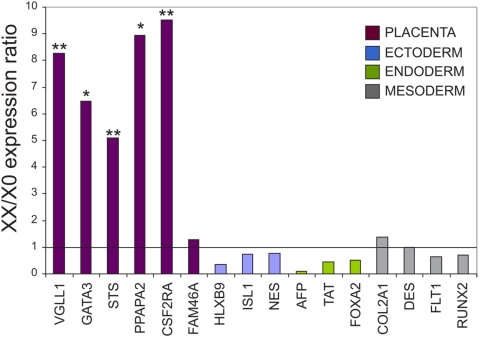
Turner's syndrome (caused by monosomy of chromosome X) is one of the most common chromosomal abnormalities in females. Although 3% of all pregnancies start with XO embryos, 99% of these pregnancies terminate spontaneously during the first trimester. The common genetic explanation for the early lethality of monosomy X embryos, as well as the phenotype of surviving individuals is haploinsufficiency of pseudoautosomal genes on the X chromosome. Another possible mechanism is null expression of imprinted genes on the X chromosome due to the loss of the expressed allele. In contrast to humans, XO mice are viable, and fertile. Thus, neither cells from patients nor mouse models can be used in order to study the cause of early lethality in XO embryos. Human embryonic stem cells (HESCs) can differentiate in culture into cells from the three embryonic germ layers as well as into extraembryonic cells. These cells have been shown to have great value in modeling human developmental genetic disorders. In order to study the reasons for the early lethality of 45,XO embryos we have isolated HESCs that have spontaneously lost one of their sex chromosomes. To examine the possibility that imprinted genes on the X chromosome play a role in the phenotype of XO embryos, we have identified genes that were no longer expressed in the mutant cells. None of these genes showed a monoallelic expression in XX cells, implying that imprinting is not playing a major role in the phenotype of XO embryos. To suggest an explanation for the embryonic lethality caused by monosomy X, we have differentiated the XO HESCs in vitro an in vivo. DNA microarray analysis of the differentiated cells enabled us to compare the expression of tissue specific genes in XO and XX cells. The tissue that showed the most significant differences between the clones was the placenta. Many placental genes are expressed at much higher levels in XX cells in compare to XO cells. Thus, we suggest that abnormal placental differentiation as a result of haploinsufficiency of X-linked pseudoautosomal genes causes the early lethality in XO human embryos.


Conflict of interest statement

Competing Interests: The authors have declared that no competing interests exist.

Figures

Figure 1
Figure 1. Isolation of XO clones from XX and XY HESCs.
A. The frequency of X or Y chromosome loss in HESCs were estimated by FISH analysis. Shown are results for X chromosome (Green) Y chromosome (Yellow) and chromosome 17 (Blue), for H9 (XX) cells, BGO1 (XY cells) and a clone of H9 that has lost one of its X chromosomes. B. Summary of the % of XO cells analyzed by FISH. The analyzed samples were either male H13 cells passage 22 and passage 44, or female H9 cells, passage 52. In each experiment 200 cells were analyzed. C. Analysis of two polymorphic markers (DXS1106 and DXS1060) on the X chromosome that are heterozygous in H9 cells. XO cells retain only one of the markers. D. PCR products of primers that distinguish between Amelogenin X and Amelogenin Y genes. XY cells (BG01) have two products whereas XX cells (H9) have only one product. XY cells that have lost the Y chromosome amplify only one band. E. Karyotype analysis of XX and XO cells. Note that in the XO cells only one X chromosome is shown.
Figure 2
Figure 2. Searching for monoallelic expression in X chromosome.
A. A scheme demonstrating the differences between the haploinsufficiency hypothesis and the imprinting hypothesis to explain the phenotype in X monosomy. Green dots represent expressed alleles and red dots represent silenced alleles. Note that according to the imprinted genes hypothesis there is no expression of the remaining allele in XO cells. B. Expression levels of several genes on the X chromosome whose expression is much higher in WT than in XO HESCs. The expression levels of STS, XIST and CXorf9 are shown in 30 d EBs and of ARSE and TBL1X in undifferentiated cells. XX – average of three microarray analyses of diploid HESCs. XO – average of two XO clones that have lost the same X chromosome. C. Searching for monoallelic expression in the candidate genes by SNP analysis at the DNA and cDNA levels.
Figure 3
Figure 3. Comparison of gene expression in WT and in XO cells upon in vitro and in vivo differentiation.
Gene expression levels were determined by U133A DNA microarray. Every dot represents one probe in the DNA microarray. In each plot the X axis represents fold induction in the expression levels of WT cells over XO cells (right side of the scale) and of Xo cells over WT cells (left side of the scale). The Y axis represents the P-value for each gene. For more details on the bioinformatic analysis see Materials and Methods. A. Analysis of genes specific to the placenta. B. Analysis of genes specific to the heart, fetal lung, fetal liver, fetal brain and whole blood. EBs – in vitro differentiation of HESCs. Teratoma – in vivo differentiation of HESCs. Solid vertical lines represents>2 fold higher level of expression solid horizontal line represent P-value = 0.05.
Figure 4
Figure 4. Confirmation of the DNA microarray data by qRT-PCR.
Relative expression levels of WT vs. XO cells for several genes enriched in either the placenta, or in tissues that correspond to the ectoderm, endoderm or mesoderm embryonic germ layers. The genes were analyzed by qRT-PCR. The solid line represents equal expression in WT and XO cells. * represents p value<0.05 and ** represents p value<0.01.

References

    1. Turner HH. Syndrome of infantilism, congenital webbed neck, and cubitus valgus. Endocrinology. 1938;23:566–574. - PubMed
    1. Saenger P. Turner's syndrome. N Engl J Med. 1996;335:1749–1754. - PubMed
    1. Ranke MB, Saenger P. Turner's syndrome. Lancet. 2001;358:309–314. - PubMed
    1. Cockwell A, MacKenzie M, Youings S, Jacobs P. A cytogenetic and molecular study of a series of 45,X fetuses and their parents. J Med Genet. 1991;28:151–155. - PMC - PubMed
    1. Zinn AR, Ross JL. Turner syndrome and haploinsufficiency. Curr Opin Genet Dev. 1998;8:322–327. - PubMed

Publication types