. 2009 Feb 1;48(3):274-84.
doi: 10.1086/595844.

Modeling the invasion of community-acquired methicillin-resistant Staphylococcus aureus into hospitals

Affiliations

Modeling the invasion of community-acquired methicillin-resistant Staphylococcus aureus into hospitals

Erica M C D'Agata et al. Clin Infect Dis. .

Abstract

Background: Methicillin-resistant Staphylococcus aureus (MRSA) has traditionally been associated with infections in hospitals. Recently, a new strain of MRSA has emerged and rapidly spread in the community, causing serious infections among young, healthy individuals. Preliminary reports imply that a particular clone (USA300) of a community-acquired MRSA (CA-MRSA) strain is infiltrating hospitals and replacing the traditional hospital-acquired MRSA strains. If true, this event would have serious consequences, because CA-MRSA infections in hospitals would occur among a more debilitated, older patient population.

Methods: A deterministic mathematical model was developed to characterize the factors contributing to the replacement of hospital-acquired MRSA with CA-MRSA and to quantify the effectiveness of interventions aimed at limiting the spread of CA-MRSA in health care settings.

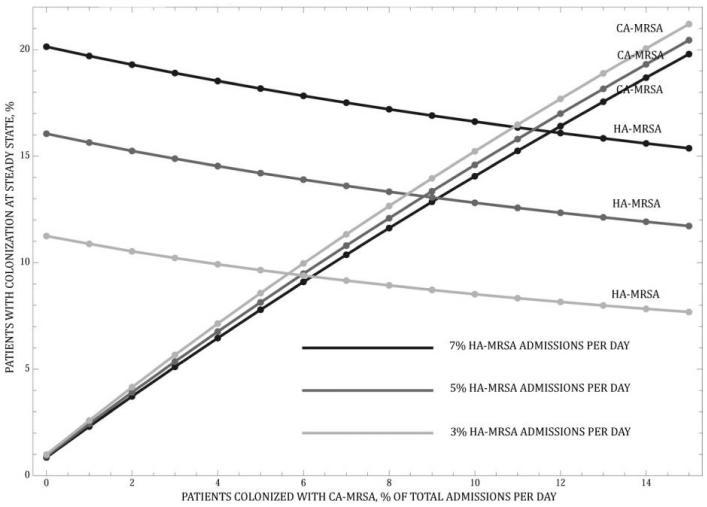
Results: The model strongly suggests that CA-MRSA will become the dominant MRSA strain in hospitals and health care facilities. This reversal of dominant strain will occur as a result of the documented expanding community reservoir and increasing influx into the hospital of individuals who harbor CA-MRSA. Competitive exclusion of hospital-acquired MRSA by CA-MRSA will occur, with increased severity of CA-MRSA infections resulting in longer hospitalizations and a larger in-hospital reservoir of CA-MRSA.

Conclusions: Improving compliance with hand hygiene and screening for and decolonization of CA-MRSA carriers are effective strategies. However, hand hygiene has the greatest return of benefits and, if compliance is optimized, other strategies may have minimal added benefit.


Figures

Figure 1
Figure 1
A compartment model of the transmission dynamics of community-acquired methicillin-resistant Staphylococcus aureus (CA-MRSA) and hospital-acquired MRSA (HA-MRSA) in a 400-bed hospital. The arrows and parameter values correspond to entry and exit from the 5 compartments. The number of hospital admissions per day is Λ, with the fractions of patients admitted with CA-MRSA colonization, CA-MRSA infection, HA-MRSA colonization, and HA-MRSA infection expressed as λCC, λCH, λIC, and λIH, respectively. The transition rates between compartments or exit rates from compartments are expressed as follows: γS, γC, and γH are exit rates of susceptible patients, patients colonized with CA-MRSA, and patients colonized with HA-MRSA, respectively (with the mean length of stay defined as 1/γS, 1/γC, and 1/γH, respectively); the colonization rates of susceptible patients to the CA-MRSA colonization compartment are (1-η)βCC/N and (1-η)βIC/N and to the HA-MRSA colonization compartment are (1-η)βCH/N and (1-η)βIC/N, where η is the compliance with hand washing hygiene (with η = 0 corresponding to 0% compliance and η = 1 corresponding to 100% compliance), βCC, βIC, βCH, and βICare the rates of colonization transmission to patients from health care workers contaminated by patients with CA-MRSA colonization, CA-MRSA infection, HA-MRSA colonization, and HA-MRSA infection, respectively, and N is the total number of patients in the hospital. The rates of infection of patients with CA-MRSA colonization and patients with HA-MRSA colonization are ϕC and ϕH, respectively. The cure rates of patients with CA-MRSA infection and HA-MRSA infection are τC and τH, respectively, and the death rates of these patients are δCand δH, respectively. The rates of decolonization of patients with CA-MRSA colonization and HA-MRSA colonization are αCC and αCH, respectively.
Figure 2
Figure 2
Numerical simulation using baseline parameter values and showing the proportion of hospitalized patients colonized or infected with community-acquired methicillin-resistant Staphylococcus aureus (CA-MRSA) and hospital-acquired MRSA (HA-MRSA) over time. The patient subpopulations converge to endemic steady states. CC, patients colonized with CA-MRSA; CH, patients colonized with HA-MRSA; IC, patients infected with CA-MRSA; IH, patients infected with HA-MRSA; t, time.
Figure 3
Figure 3
Effect of an increased influx of patients colonized with community-acquired methicillin-resistant Staphylococcus aureus (CA-MRSA) and the feedback loop that creates a decrease in the influx of patients colonized with hospital-acquired MRSA (HA-MRSA). The percentage of admissions that are of patients colonized with HA-MRSA are held constant at 3%, 5%, and a baseline value of 7% as the percentage of admissions that are of patients colonized with CA-MRSA increases from 0% to 15%.
Figure 4
Figure 4
Effect of an increased influx of patients colonized with community-acquired methicillin-resistant Staphylococcus aureus (CA-MRSA) and the feedback loop that creates a decrease in the influx of patients colonized with hospital-acquired MRSA (HA-MRSA) when the transmission risk of CA-MRSA is equal to that of HA-MRSA (βCC = βCH = .27 and βIC = βIH = .07).
Figure 5
Figure 5
The effect of increased admissions of patients colonized with community-acquired methicillin-resistant Staphylococcus aureus (CA-MRSA) and the effect of an increased length of stay (LOS) among patients colonized with CA-MRSA (A) and patients infected with CA-MRSA (B) on the percentage of patients colonized with CA-MRSA.
Figure 6
Figure 6
Comparison of the percentage of patients colonized with community-acquired methicillin-resistant Staphylococcus aureus (CA-MRSA) at steady state for 3 interventions (hand hygiene, screening, and decolonization). In the models shown, patients colonized with CA-MRSA account for 3% of admissions per day (baseline; A), 6% per day (B), 10% per day (C), and 20% per day (D).
Figure 7
Figure 7
Comparison of the percentage of patients colonized with community-acquired methicillin-resistant Staphylococcus aureus (CA-MRSA) at steady state for hand hygiene compliance, screening, and decolonization interventions. A, Hand hygiene compliance increases from 0% to 100% and the efficacy of decolonization increases from 0% to 25%, 50%, 75% and 100%. B, Hand hygiene compliance increases from 0% to 100% and the efficacy of the screening intervention increases from 0% to 25%, 50%, 75%, and 100%. C, The efficacy of the decolonization strategy increases from 0% to 100% and the efficacy of the screening strategy increases from 0% to 25%, 50%, 75%, and 100%.

References

    1. Klevens RM, Morrison MA, Nadle J, et al. Invasive methicillin-resistant Staphylococcus aureus infections in the United States. JAMA. 2007;298:1763–71. - PubMed
    1. Bancroft EA. Antimicrobial resistance, it’s not just for hospitals. JAMA. 2007;298:1803–4. - PubMed
    1. Kuehnert MJ, Hill HA, Kupronis BA, Tokars JI, Solomon SL, Jernigan DB. Methicillin-resistant Staphylococcus aureus hospitalizations, United States. Emerg Infect Dis. 2005;11:868–72. - PMC - PubMed
    1. Herold BC, Immergluck LC, Maranan LC, et al. Community-acquired methicillin-resistant Staphylococcus aureus in children with no identified predisposing risk. JAMA. 1998;279:593–8. - PubMed
    1. Tristan A, Bes M, Meugnier H, et al. Global distribution of panton-valentine leukocidin–positive methicillin-resistant Staphylococcus aureus, 2006. Emerg Infect Dis. 2007;13:594–600. - PMC - PubMed

Publication types

MeSH terms