Comparative Study
. 2009 Feb 15;199(4):537-546.
doi: 10.1086/596507.

Patterns of gene transcript abundance in the blood of children with severe or uncomplicated dengue highlight differences in disease evolution and host response to dengue virus infection

Affiliations
Comparative Study

Patterns of gene transcript abundance in the blood of children with severe or uncomplicated dengue highlight differences in disease evolution and host response to dengue virus infection

Hoang Truong Long et al. J Infect Dis. .

Abstract

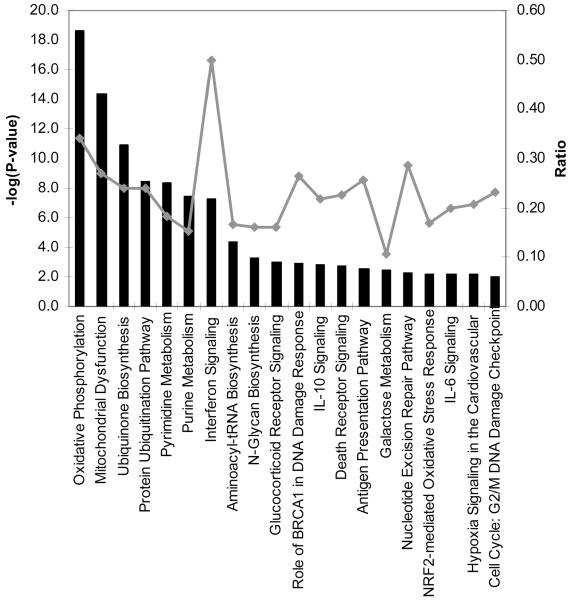
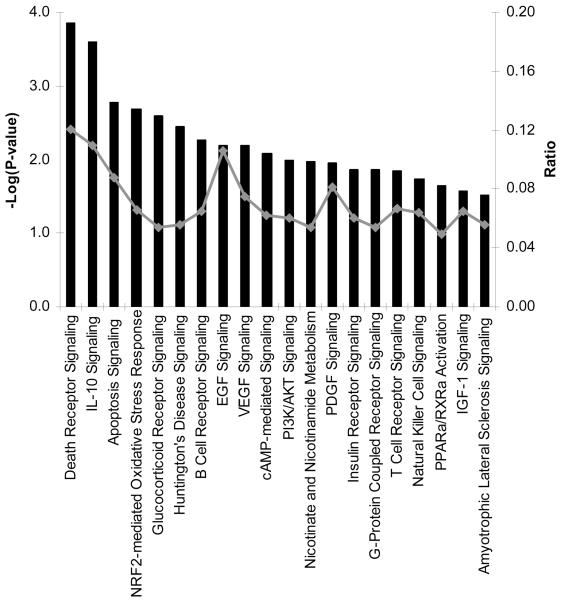
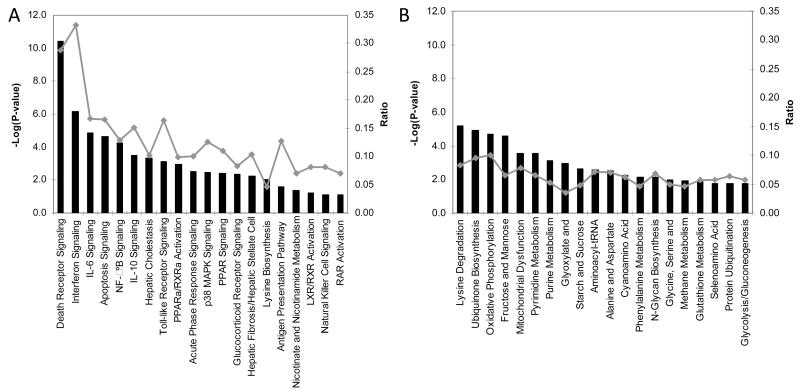
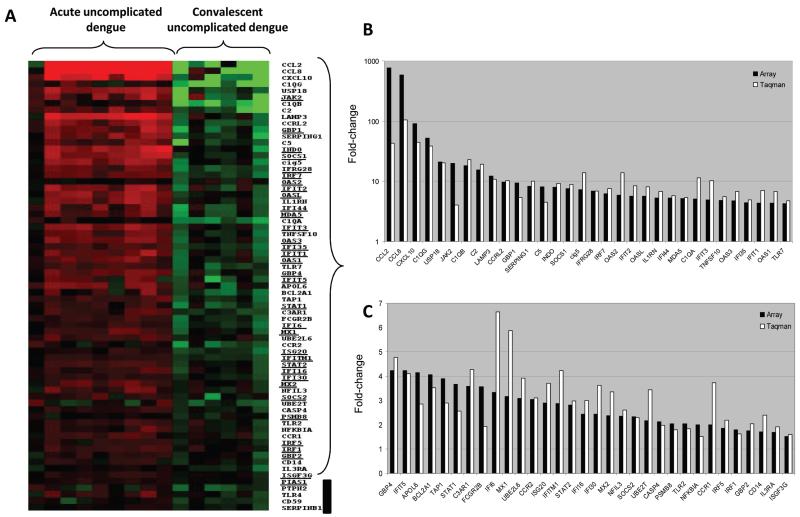
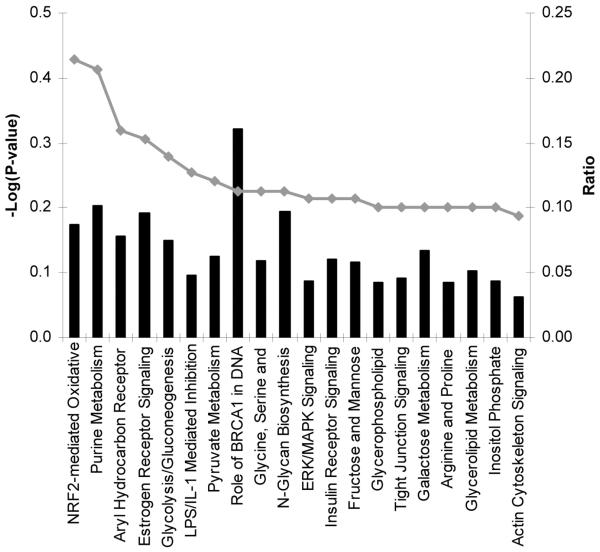
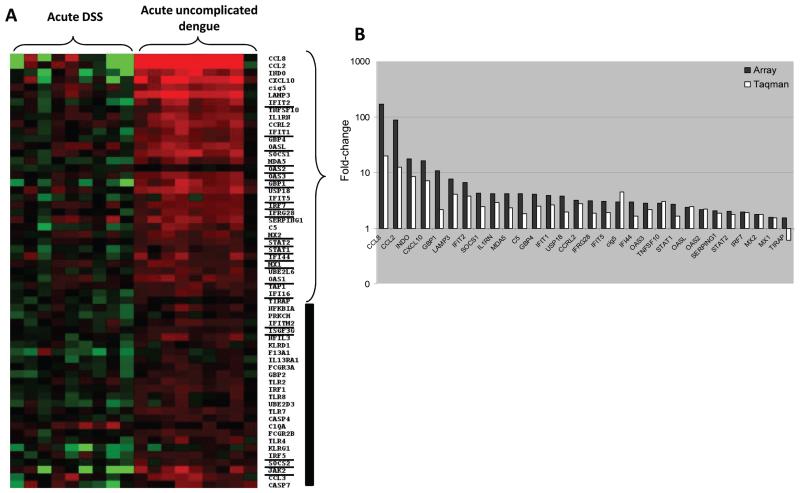
DNA microarrays and specific reverse-transcription polymerase chain reaction assays were used to reveal transcriptional patterns in the blood of children presenting with dengue shock syndrome (DSS) and well-matched patients with uncomplicated dengue. The transcriptome of patients with acute uncomplicated dengue was characterized by a metabolically demanding "host-defense" profile; transcripts related to oxidative metabolism, interferon signaling, protein ubiquination, apoptosis, and cytokines were prominent. In contrast, the transcriptome of patients with DSS was surprisingly benign, particularly with regard to transcripts derived from apoptotic and type I interferon pathways. These data highlight significant heterogeneity in the type or timing of host transcriptional immune responses precipitated by dengue virus infection independent of the duration of illness. In particular, they suggest that, if transcriptional events in the blood compartment contribute to capillary leakage leading to hypovolemic shock, they occur before cardiovascular decompensation, a finding that has implications for rational adjuvant therapy in this syndrome.


Figures

Figure 1
Figure 1. Pathway analysis of transcripts enriched in acute samples from patients with uncomplicated dengue.
Shown are the top 20 canonical pathways identified by unsupervised pathway analysis of filtered microarray data representing transcripts enriched (n = 2204) in acute samples (day 4 of illness) from patients with uncomplicated dengue relative to autologous convalescent samples (day 30). The strength of the statistical association is indicated by the length of the bars. The ratio value reflects the proportion of gene elements on the enriched gene list that belong to one of these canonical pathways.
Figure 2
Figure 2. Pathway analysis of transcripts enriched in acute samples from patients with dengue shock syndrome (DSS).
Figure 3
Figure 3. Pathway analysis of transcripts less abundant in acute samples from patients with dengue shock syndrome (DSS).
Shown are the top 20 canonical pathways identified by unsupervised pathway analysis of filtered microarray data representing transcripts less abundant (n = 523) in acute samples (day 4 of illness) from patients with DSS relative to autologous convalescent samples (day 30). The strength of the statistical association is indicated by the length of the bars. The ratio value reflects the proportion of gene elements on the enriched gene list that belong to one of these canonical pathways.
Figure 4
Figure 4. Pathway analysis of transcripts enriched or less abundant in acute samples from patients with uncomplicated dengue relative to that in acute samples from patients with dengue shock syndrome (DSS).
Shown are the top 20 canonical pathways identified by unsupervised pathway analysis of filtered microarray data representing transcripts significantly enriched (n = 1030) (A) or less abundant (n = 719) (B) in acute samples (day 4 of illness) from patients with uncomplicated dengue relative to that in acute samples from patients with DSS. The strength of the statistical association is indicated by the length of the bars. The ratio value reflects the proportion of gene elements on the enriched gene list that belong to one of these canonical pathways.
Figure 5
Figure 5. Reverse-transcription polymerase chain reaction (RT-PCR) validation of transcripts enriched in acute samples from patients with uncomplicated dengue relative to autologous convalescent samples.
Shown in panel A is a heat map of individual patient samples filtered on those transcripts enriched in acute samples (day 4 of illness) from patients with uncomplicated dengue relative to autologous convalescent samples (day 30) (n = 69) that were selected for RT-PCR validation. The gene symbols of canonical type I interferon–stimulated genes are underlined next to the heat map. Shown in panels B and C are graphs representing the mean fold difference in abundance for 64 (93%) of the 69 transcripts that were validated by RT-PCR. The fold difference is shown for both microarray analysis (black bars) and RT-PCR analysis (white bars), with values >1 indicating greater abundance in acute samples. Five of the 69 transcripts were not validated by RT-PCR (shown by the black vertical line next to the heat map).
Figure 6
Figure 6. Reverse-transcription polymerase chain reaction (RT-PCR) validation of transcripts enriched or less abundant in acute samples from patients with dengue shock syndrome (DSS) relative to that in convalescent samples.
Figure 7
Figure 7. Reverse-transcription polymerase chain reaction (RT-PCR) validation of transcripts enriched in acute samples from patients with uncomplicated dengue relative to that in acute samples from patients with dengue shock syndrome (DSS).
Shown in panel A is a heat map of individual patient samples filtered on those transcripts (n = 59) enriched in acute samples from patients with uncomplicated dengue relative to that in acute samples from patients with DSS that were selected for RT-PCR validation. The gene symbols of canonical type I interferon–stimulated genes are underlined next to the heat map. Shown in panel B is a graph representing the mean fold difference in the abundance of 30 (51%) of the 59 transcripts that were validated by RT-PCR. The fold difference is shown for both microarray analysis (black bars) and RT-PCR analysis (white bars), with values >1 indicating greater abundance in acute samples. Twenty-nine of the 59 transcripts were not validated by RT-PCR (shown by the black vertical line next to the heat map).

References

    1. Thein S, Aung MM, Shwe TN, et al. Risk factors in dengue shock syndrome. Am J Trop Med Hyg. 1997;56:566–72. - PubMed
    1. Burke DS, Nisalak A, Johnson DE, Scott RM. A prospective study of dengue infections in Bangkok. Am J Trop Med Hyg. 1988;38:172–80. - PubMed
    1. Sangkawibha N, Rojanasuphot S, Ahandrik S, et al. Risk factors in dengue shock syndrome: a prospective epidemiologic study in Rayong, Thailand. I. The 1980 outbreak. Am J Epidemiol. 1984;120:653–69. - PubMed
    1. Halstead SB, Lan NT, Myint TT, et al. Dengue hemorrhagic fever in infants: research opportunities ignored. Emerg Infect Dis. 2002;8:1474–9. - PMC - PubMed
    1. Mangada MM, Endy TP, Nisalak A, et al. Dengue-specific T cell responses in peripheral blood mononuclear cells obtained prior to secondary dengue virus infections in Thai schoolchildren. J Infect Dis. 2002;185:1697–703. - PubMed

Publication types