. 2009 Jan 12:9:2.
doi: 10.1186/1471-2288-9-2.

Assessment of regression-based methods to adjust for publication bias through a comprehensive simulation study

Affiliations

Assessment of regression-based methods to adjust for publication bias through a comprehensive simulation study

Santiago G Moreno et al. BMC Med Res Methodol. .

Abstract

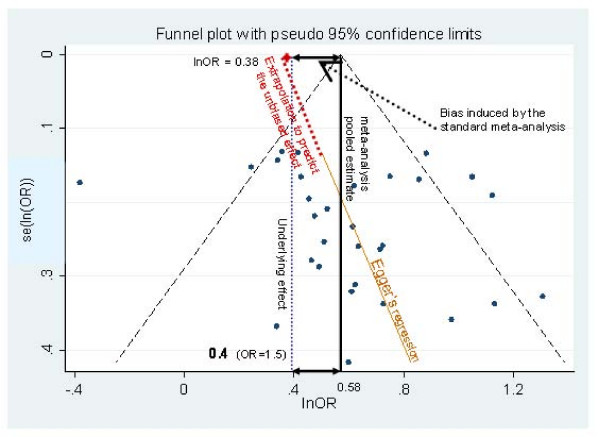
Background: In meta-analysis, the presence of funnel plot asymmetry is attributed to publication or other small-study effects, which causes larger effects to be observed in the smaller studies. This issue potentially mean inappropriate conclusions are drawn from a meta-analysis. If meta-analysis is to be used to inform decision-making, a reliable way to adjust pooled estimates for potential funnel plot asymmetry is required.

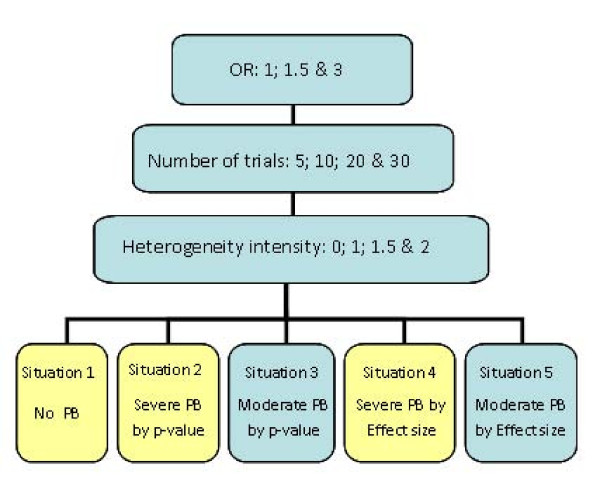
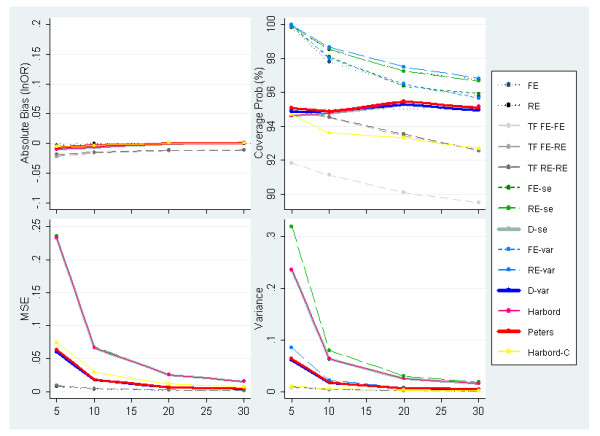
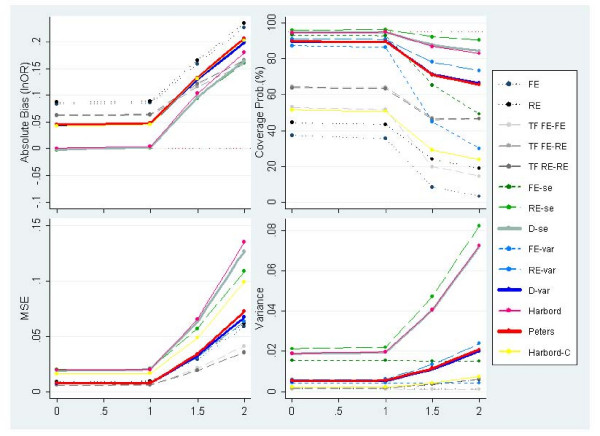
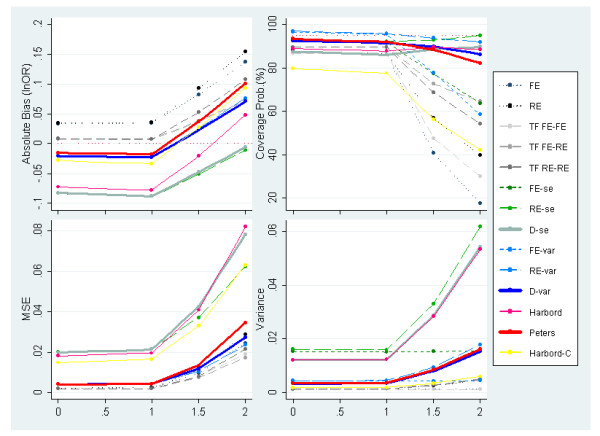
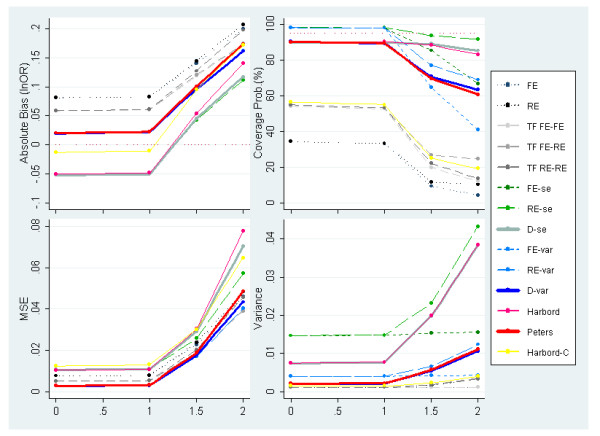
Methods: A comprehensive simulation study is presented to assess the performance of different adjustment methods including the novel application of several regression-based methods (which are commonly applied to detect publication bias rather than adjust for it) and the popular Trim & Fill algorithm. Meta-analyses with binary outcomes, analysed on the log odds ratio scale, were simulated by considering scenarios with and without i) publication bias and; ii) heterogeneity. Publication bias was induced through two underlying mechanisms assuming the probability of publication depends on i) the study effect size; or ii) the p-value.

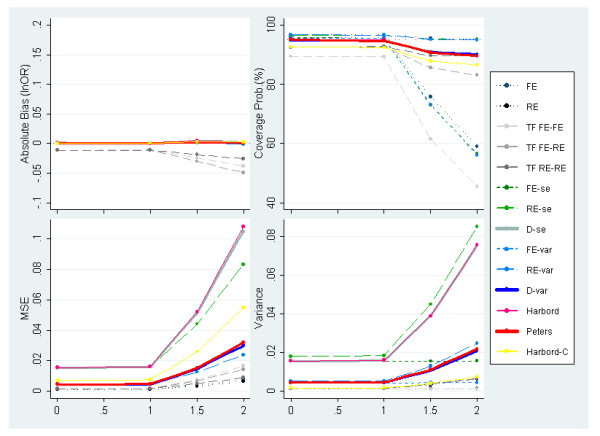
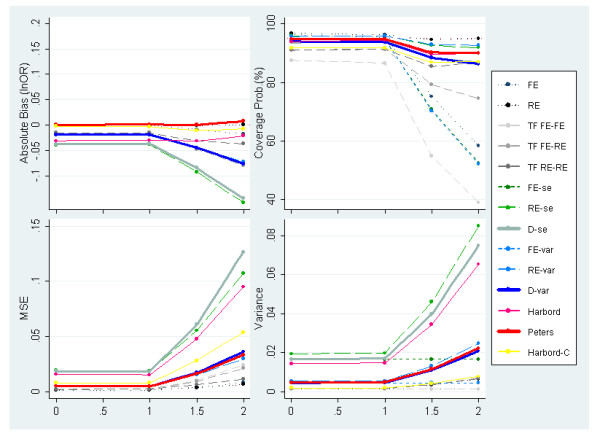
Results: The performance of all methods tended to worsen as unexplained heterogeneity increased and the number of studies in the meta-analysis decreased. Applying the methods conditional on an initial test for the presence of funnel plot asymmetry generally provided poorer performance than the unconditional use of the adjustment method. Several of the regression based methods consistently outperformed the Trim & Fill estimators.

Conclusion: Regression-based adjustments for publication bias and other small study effects are easy to conduct and outperformed more established methods over a wide range of simulation scenarios.


Figures

Figure 1
Figure 1
Regression line and standard meta-analysis on a funnel plot of simulated asymmetrical data.
Figure 2
Figure 2
Schematic outlining the meta-analysis scenarios simulated. 5000 meta-analysis datasets for each combination of the 3 underlying odds ratios, 4 different numbers of trials in the meta-analysis, 4 levels of heterogeneity, and 5 PB situations (240 scenarios in total) were generated.
Figure 3
Figure 3
Measures of absolute bias, coverage probabilities, MSE and precision of the predicted effect for meta-analyses simulated to have 30 studies, an underlying OR of 1 (lnOR = 0) and no PB alongside increasing levels of heterogeneity (PB situation 1).
Figure 4
Figure 4
Measures of absolute bias, coverage probabilities, MSE and variance of the predicted effect for meta-analyses simulated to have 30 studies, an underlying OR of 3 (lnOR = 1.1) and no PB alongside increasing levels of heterogeneity (PB situation 1).
Figure 5
Figure 5
Measures of absolute bias, coverage probabilities, MSE and precision of the predicted effect for homogeneous meta-analyses and underlying OR of 1 (lnOR = 0) and no PB alongside increasing meta-analysis sizes (PB situation 1).
Figure 6
Figure 6
Measures of absolute bias, coverage probabilities, MSE and variance of the predicted effect for meta-analyses simulated to have 30 studies, an underlying OR of 1 (lnOR = 0) and severe PB induced by p-value alongside increasing heterogeneity (PB situation 2).
Figure 7
Figure 7
Measures of absolute bias, coverage probabilities, MSE and variance of the predicted effect for meta-analyses simulated to have 30 studies, an underlying OR = 1.5(lnOR = 0.4) and severe PB induced by p-value alongside increasing heterogeneity (PB situation 2).
Figure 8
Figure 8
Measures of absolute bias, coverage probabilities, MSE and variance of the predicted effect for meta-analyses simulated to have 30 studies, an underlying OR = 1 (lnOR = 0) and severe PB induced by effect size alongside increasing heterogeneity (PB situation 4).

References

    1. Turner EH, Matthews AM, Linardatos E, Tell RA, Rosenthal R. Selective Publication of Antidepressant Trials and Its Influence on Apparent Efficacy. N Engl J Med. 2008;358(3):252. doi: 10.1056/NEJMsa065779. - DOI - PubMed
    1. Metcalfe S, Burgess C, Laking G, Evans J, Wells S, Crausaz S. Trastuzumab: possible publication bias. Lancet. 2008;371(9625):1646–1648. doi: 10.1016/S0140-6736(08)60706-0. - DOI - PubMed
    1. Smith ML. Publication bias and meta-analysis. Evaluation in Education. 1980;4:22–24. doi: 10.1016/0191-765X(80)90004-X. - DOI
    1. Sterne JAC, Gavaghan D, Egger M. Publication and related bias in meta-analysis: Power of statistical tests and prevalence in the literature. J Clin Epidemiol. 2000;53:1119–1129. doi: 10.1016/S0895-4356(00)00242-0. - DOI - PubMed
    1. Sterne JAC, Egger M. Funnel plots for detecting bias in meta-analysis: Guidelines on choice of axis. J Clin Epidemiol. 2001;54:1046–1055. doi: 10.1016/S0895-4356(01)00377-8. - DOI - PubMed

Publication types

LinkOut - more resources