. 2009 Apr;197(2):135-44.
doi: 10.1016/j.jmr.2008.12.008. Epub 2008 Dec 14.

A low-E magic angle spinning probe for biological solid state NMR at 750 MHz

Affiliations

A low-E magic angle spinning probe for biological solid state NMR at 750 MHz

Seth A McNeill et al. J Magn Reson. 2009 Apr.

Abstract

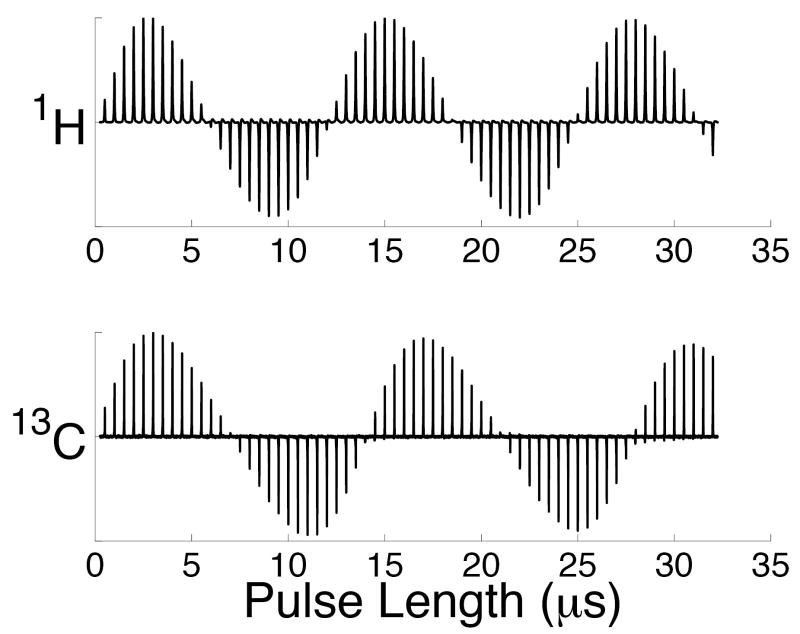
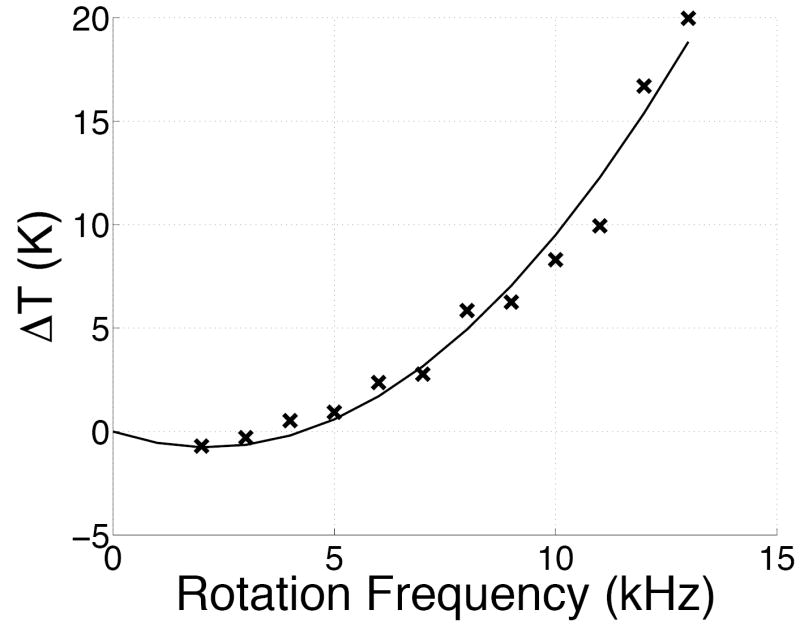
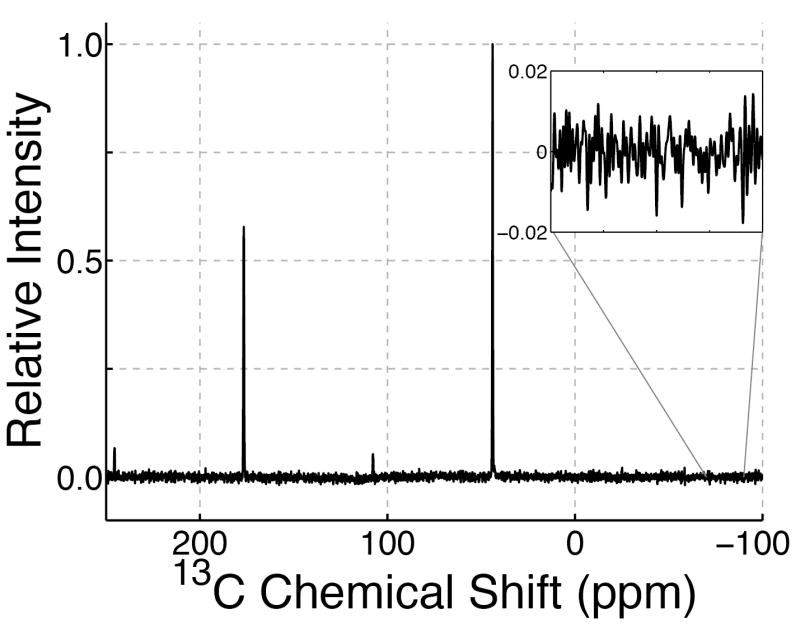
Crossed-coil NMR probes are a useful tool for reducing sample heating for biological solid state NMR. In a crossed-coil probe, the higher frequency (1)H field, which is the primary source of sample heating in conventional probes, is produced by a separate low-inductance resonator. Because a smaller driving voltage is required, the electric field across the sample and the resultant heating is reduced. In this work we describe the development of a magic angle spinning (MAS) solid state NMR probe utilizing a dual resonator. This dual resonator approach, referred to as "low-E," was originally developed to reduce heating in samples of mechanically aligned membranes. The study of inherently dilute systems, such as proteins in lipid bilayers, via MAS techniques requires large sample volumes at high field to obtain spectra with adequate signal-to-noise ratio under physiologically relevant conditions. With the low-E approach, we are able to obtain homogeneous and sufficiently strong radiofrequency fields for both (1)H and (13)C frequencies in a 4mm probe with a (1)H frequency of 750 MHz. The performance of the probe using windowless dipolar recoupling sequences is demonstrated on model compounds as well as membrane-embedded peptides.


Figures

Fig. 1
Fig. 1
(a) Physical dimensions of the coils (in millimeters) and their integration into a MAS stator using a Teflon coil centering platform; (b) photograph of the probe head. The Teflon coil platform and 2 pairs of leads can be seen at the bottom of the stator. The observe solenoid is made using a variable pitch winding which is not reflected in the drawing
Fig. 2
Fig. 2
Schematics of the double-tuned rf matching network. L0C0 forms the 1H loop gap resonator with the detection solenoid inside (L1). Inductors L3 and L4 (5–10 nH each) represent flexible leads connecting sample coils to the 1H and 13C circuits. C1, C2, and C3 are variable capacitors for, respectively, matching, balancing, and tuning the 1H LGR. In the low frequency channel, C5 is used for matching and C6 and C7 tuning capacitors are connected to a single tuning rod via a gear mechanism. Retuning to different observe nuclei (e.g. 15N) is done by replacing a tuning chip, C8, and a balancing chip, C7A. A low-voltage 1H rejection trap, L2C4, is placed at the entry of the 13C rf cable.
Fig. 3
Fig. 3
a. B1 homogeneity characteristics for the 1H (black squares) and 13C (gray diamonds) channels as a function of sample length The 13C solenoidal coil length, 8.3 mm, is indicated by the dashed vertical line. As expected, homogeneity is high and improves when the sample is confined within the coil. b. Nutation profiles for the 1H (top) and 13C (bottom) channels collected using an adamantane sample. Each peak corresponds to the monitored resonance as a function of the pulse length. (a) 1H spectra in 0.5 μs increments for a sample length of 6.7 mm and (b) 13C spectra in 0.5 μs increments for a sample length of 6.7 mm.
Fig. 3
Fig. 3
a. B1 homogeneity characteristics for the 1H (black squares) and 13C (gray diamonds) channels as a function of sample length The 13C solenoidal coil length, 8.3 mm, is indicated by the dashed vertical line. As expected, homogeneity is high and improves when the sample is confined within the coil. b. Nutation profiles for the 1H (top) and 13C (bottom) channels collected using an adamantane sample. Each peak corresponds to the monitored resonance as a function of the pulse length. (a) 1H spectra in 0.5 μs increments for a sample length of 6.7 mm and (b) 13C spectra in 0.5 μs increments for a sample length of 6.7 mm.
Fig. 4
Fig. 4
a. Average rf sample heating at three different sample lengths and two salt concentrations. Black filled circles: 20 mM TmDOTP5- with a 3.7 mm sample length. Black filled squares: 20 mM TmDOTP5- and 150 mM NaCl with a 3.7 mm sample length. Gray filled symbols correspond to the same solutions with a 6.7 mm sample length, and the empty symbols correspond to the same solutions with an 11.7 mm sample length. Lines are linear fits to the data as a visual guide. Note that because of its high ionic strength, small concentration of TmDOTP5- still contribute significant rf loss. The rf heating remains under 15 K for all samples, and either decreasing the sample length or the salt concentration further reduces the heating. Average power was varied by keeping the duty cycle constant at 3.8% and varying the presaturation pulse power. A delay of 5 ms between the presaturation pulse and the acquire pulse was used and 256 dummy scans (~ 5 minutes) were run before acquiring to make sure the sample had reached equilibrium temperature. b. Frictional heating due to MAS. The sample temperature was monitored using a sample containing 10% lead nitrate (Pb(NO3)2) diluted with NaCl to reduce its density. The airlines were kept at room temperature. The line is a quadratic fit through the origin. The initial temperature drop is due to Joule-Thomson cooling. Heating at 13 kHz MAS reaches 20 K, which is enough to be a problem for biological samples, but it can be mitigated by cooling the airlines.
Fig. 4
Fig. 4
a. Average rf sample heating at three different sample lengths and two salt concentrations. Black filled circles: 20 mM TmDOTP5- with a 3.7 mm sample length. Black filled squares: 20 mM TmDOTP5- and 150 mM NaCl with a 3.7 mm sample length. Gray filled symbols correspond to the same solutions with a 6.7 mm sample length, and the empty symbols correspond to the same solutions with an 11.7 mm sample length. Lines are linear fits to the data as a visual guide. Note that because of its high ionic strength, small concentration of TmDOTP5- still contribute significant rf loss. The rf heating remains under 15 K for all samples, and either decreasing the sample length or the salt concentration further reduces the heating. Average power was varied by keeping the duty cycle constant at 3.8% and varying the presaturation pulse power. A delay of 5 ms between the presaturation pulse and the acquire pulse was used and 256 dummy scans (~ 5 minutes) were run before acquiring to make sure the sample had reached equilibrium temperature. b. Frictional heating due to MAS. The sample temperature was monitored using a sample containing 10% lead nitrate (Pb(NO3)2) diluted with NaCl to reduce its density. The airlines were kept at room temperature. The line is a quadratic fit through the origin. The initial temperature drop is due to Joule-Thomson cooling. Heating at 13 kHz MAS reaches 20 K, which is enough to be a problem for biological samples, but it can be mitigated by cooling the airlines.
Fig. 5
Fig. 5
a. NAGLY 13C CPMAS spectrum after 8 scans with a sample length of 6.9 mm containing 67.3 mg of glycine spinning at 13 kHz. Inset is a magnification of the noise used in the S/N measurement. This particular spectrum has a S/N measurement of 301. b. S/N for NAGLY as a function of sample length. Shown are the S/N normalized for the number of scans (solid circles, left axis) as well as the S/N per unit mass (open squares, right axis), also normalized for the number of scans.
Fig. 5
Fig. 5
a. NAGLY 13C CPMAS spectrum after 8 scans with a sample length of 6.9 mm containing 67.3 mg of glycine spinning at 13 kHz. Inset is a magnification of the noise used in the S/N measurement. This particular spectrum has a S/N measurement of 301. b. S/N for NAGLY as a function of sample length. Shown are the S/N normalized for the number of scans (solid circles, left axis) as well as the S/N per unit mass (open squares, right axis), also normalized for the number of scans.
Fig. 6
Fig. 6
CPMAS matching condition profile for adamantane at 10 kHz MAS using a square spinlock pulse on both rf channels. The 1H rf field was held constant at (ω1/2π) ~ 35 kHz while the 13C B1 field was varied; the signal is graphed as a function of the rf mismatch. The solid line corresponds to a sample length of 3.7 mm; the dashed line corresponds to a sample length of 11.7 mm. The X-axis is the average 13C B1 field minus the average 1H B1 field. The longer sample (11.7 mm, dotted line) has broader, weaker matching conditions. This is from the wider range of rf energy the sample is exposed to due to the lower homogeneity of the 13C B1 field. The shorter sample (3.7 mm, solid line) shows excellent agreement with theory with maximal signal at mismatch levels equal to integer values of the spinning speed.
Fig. 7
Fig. 7
13C CPMAS spectrum of nanocrystalline natural abundance lysozyme.
Fig. 8
Fig. 8
A 2D-DQCSA spectrum for *G*AV.
Fig. 9
Fig. 9
(top) CPMAS and DQ-filtered spectra for the 21 amino acid peptide KL4 13C′-enriched at positions L9 and L10 and incorporated into DPPC:POPG lipid vesicles at a peptide:lipid molar ratio >1:50; the signals in the aliphatic region are primarily from the surrounding lipids. (middle) 2D-DQ CSA correlation data for the KL4 sample along with best fit simulations. Closed and open symbols are data collected at 750 and 500 MHz, respectively; solid and dashed lines correspond to the signal trajectories for the best fit (ϕ,ψ) simulations at the two fields. (bottom) χ2 evaluation of simulations with varying ψ while holding ϕ at a value obtained from DQ buildup experiments; solid and dashed lines correspond to fitting of data at 750 and 500 MHz, respectively. Note the improved selectivity of the χ2 evaluation at 750 MHz due to the increased CSAs at the higher magnetic field.

References

    1. Paulson EK, Martin RW, Zilm KW. Cross polarization, radio frequency field homogeneity, and circuit balancing in high field solid state NMR probes. J Magn Reson. 2004;171:314–323. - PubMed
    1. Gor’kov PL, Chekmenev EY, Fu RQ, Hu J, Cross TA, Cotten M, Brey WW. A large volume flat coil probe for oriented membrane proteins. J Magn Reson. 2006;181:9–20. - PubMed
    1. Martin RW, Paulson EK, Zilm KW. Design of a triple resonance magic angle sample spinning probe for high field solid state nuclear magnetic resonance. Rev Sci Instrum. 2003;74:3045–3061.
    1. Stringer JA, Bronnimann CE, Mullen CG, Zhou DH, Stellfox SA, Li Y, Williams EH, Rienstra CM. Reduction of RF-induced sample heating with a scroll coil resonator structure for solid-state NMR probes. J Magn Reson. 2005;173:40–48. - PubMed
    1. de Lacaillerie JBD, Jarry B, Pascui O, Reichert D. “Cooking the sample”: Radiofrequency induced heating during solid-state NMR experiments. Solid State NMR. 2005;28:225–232. - PubMed

Publication types

LinkOut - more resources