Multicenter Study
. 2008 Jun;1(1):56-64.
doi: 10.1158/1940-6207.CAPR-08-0011. Epub 2008 Mar 31.

A prediction model for lung cancer diagnosis that integrates genomic and clinical features

Affiliations
Multicenter Study

A prediction model for lung cancer diagnosis that integrates genomic and clinical features

Jennifer Beane et al. Cancer Prev Res (Phila). 2008 Jun.

Abstract

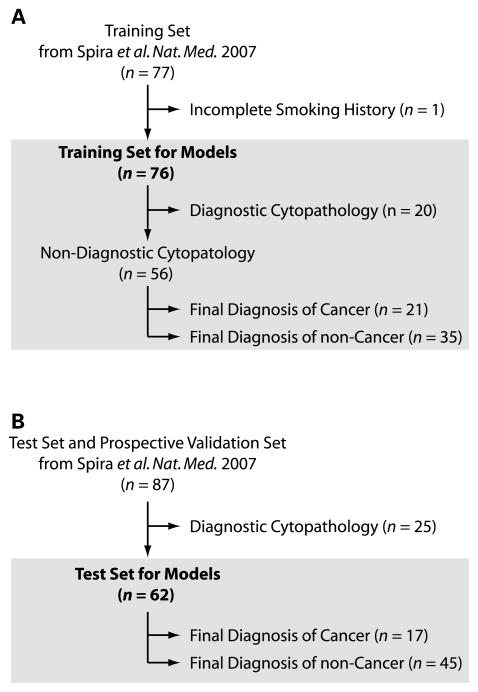
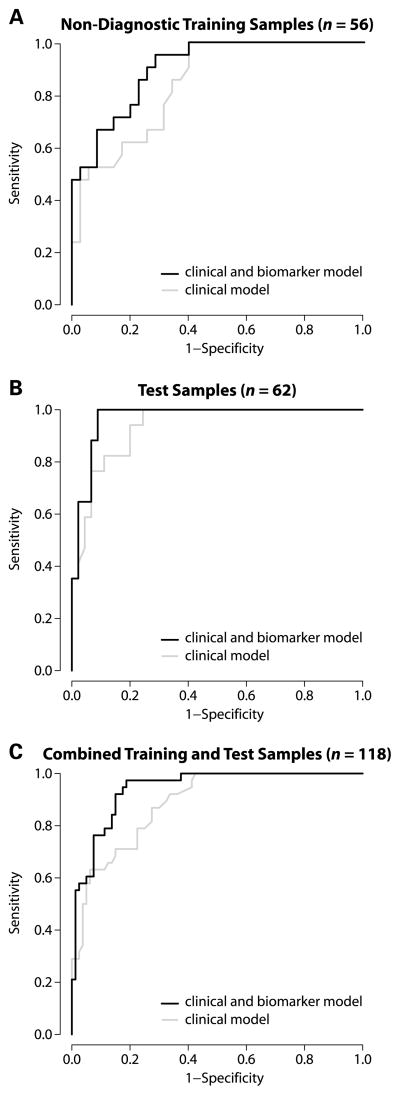
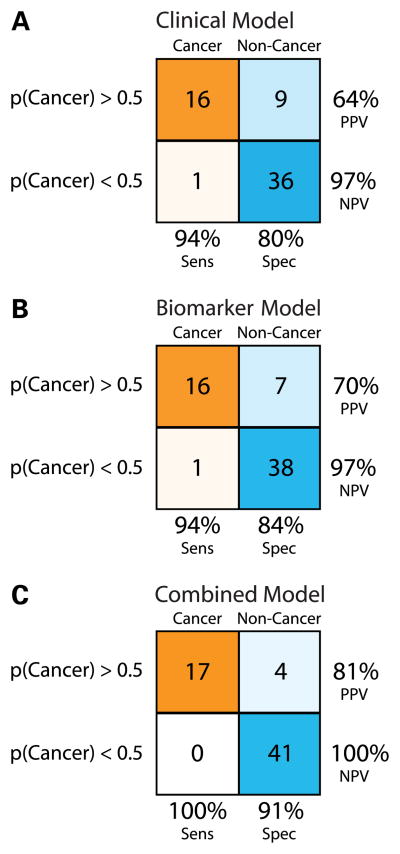
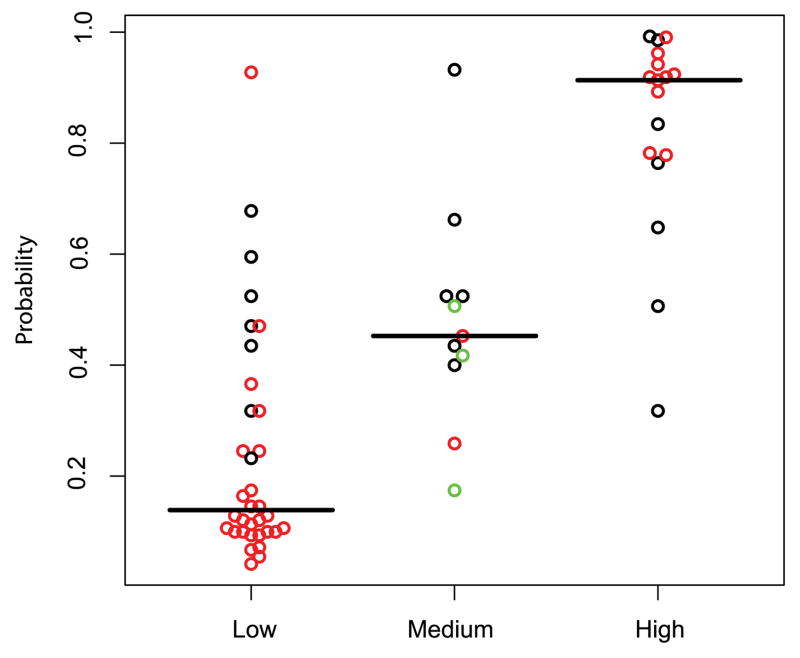
Lung cancer is the leading cause of cancer death due, in part, to lack of early diagnostic tools. Bronchoscopy represents a relatively noninvasive initial diagnostic test in smokers with suspect disease, but it has low sensitivity. We have reported a gene expression profile in cytologically normal large airway epithelium obtained via bronchoscopic brushings, which is a sensitive and specific biomarker for lung cancer. Here, we evaluate the independence of the biomarker from other clinical risk factors and determine the performance of a clinicogenomic model that combines clinical factors and gene expression. Training (n = 76) and test (n = 62) sets consisted of smokers undergoing bronchoscopy for suspicion of lung cancer at five medical centers. Logistic regression models describing the likelihood of having lung cancer using the biomarker, clinical factors, and these data combined were tested using the independent set of patients with nondiagnostic bronchoscopies. The model predictions were also compared with physicians' clinical assessment. The gene expression biomarker is associated with cancer status in the combined clinicogenomic model (P < 0.005). There is a significant difference in performance of the clinicogenomic relative to the clinical model (P < 0.05). In the test set, the clinicogenomic model increases sensitivity and negative predictive value to 100% and results in higher specificity (91%) and positive predictive value (81%) compared with other models. The clinicogenomic model has high accuracy where physician assessment is most uncertain. The airway gene expression biomarker provides information about the likelihood of lung cancer not captured by clinical factors, and the clinicogenomic model has the highest prediction accuracy. These findings suggest that use of the clinicogenomic model may expedite more invasive testing and definitive therapy for smokers with lung cancer and reduce invasive diagnostic procedures for individuals without lung cancer.


Figures

Figure 1
Figure 1
Training and test sample sets. The training and test samples were derived from a previously published study assaying airway epithelial gene expression from current and former smokers undergoing bronchoscopy for the clinical suspicion of lung cancer. (A.) We previously constructed a gene-expression biomarker that predicts the presence of lung cancer using a training set of 77 patients. For the current study, one of these samples was removed due to incomplete smoking history, resulting in the logistic regression models being trained with data from 76 patients. The models were subsequently tested on the subset of training samples (n=56) that had cytopathology that was non-diagnostic of lung cancer. (B.) The biomarker was also tested on the subset of independent samples with non-diagnostic cytopathology (n =62) from the combined test and prospective validation sample sets (n = 87) used in our previous study.
Figure 2
Figure 2
ROC curves for the clinical model and the clinicogenomic model across the different sample sets. The clinical model (gray line) includes the following variables: age, mass size, and lymphadenopathy, while the clinical and biomarker model includes the above variables and the biomarker score (black line). Both models were derived using the training set samples (n=76). (A.) ROC analysis of the non-diagnostic training set samples (n = 56). The AUC for the clinical and clinicogenomic model is 0.84 and 0.90, respectively. (B.) ROC analysis of the test samples (n = 62). The AUC for the clinical and clinicogenomic model is 0.94 and 0.97, respectively. (C.) ROC analysis of the combined training and test sets (n = 118). The AUC for the clinical and clinicogenomic model is 0.89 and 0.94, respectively, which represents a significant difference between the two curves (p <0.05).
Figure 3
Figure 3
Performance of three logistic regression models across the test set samples. Samples with model derived probabilities of having lung cancer greater than or equal to 0.5 were classified as cancer, and samples with probabilities less than 0.5 were classified as non-cancer. Samples with a final diagnosis of cancer are indicated in orange while samples with a final diagnosis of no cancer are indicated in blue. The saturation of the colors is representative of the proportion of each final diagnosis group classified as having cancer or no cancer by each of the models. For each model, the sensitivity (Sens), specificity (Spec), positive predictive value (PPV), and the negative predictive value (NPV) are shown. (A.) The Clinical Model (B.) The Biomarker Model (C.) The Clinicogenomic Model. The Clinical Model and the Biomarker Model each perform similarly with accuracies of 84% and 87%, respectively. The Clinicogenomic Model has a greater accuracy (94%), specificity, and PPV than either of the other two models.
Figure 4
Figure 4
Association between the probability of having lung cancer as predicted by the clinical model and physician’s subjective assessment across the test set samples (n=62). The model derived probabilities are shown on the y-axis and the subjective clinical assessment on the x-axis. Red circles indicate complete agreement among 3 clinicians, black indicates agreement of 2 clinicians, and green indicates no agreement. There are significant differences (Wilcoxon test; p < 0.01) between the probabilities in the low versus medium group, the medium versus high group, and the low versus high group.
Figure 5
Figure 5
The clinicogenomic model-derived lung cancer predictions stratified by cancer status and the physician’s subjective assessment across the test set samples (n=62). Dark gray represents a final diagnosis of cancer and light gray represents a final diagnosis of non-cancer. Squares represent correct clinicogenomic model predictions and circles represent incorrect model predictions. Each of the samples classified as having a medium risk of lung cancer by physicians was predicted correctly by the clinicogenomic model.

References

    1. Parkin DM, Bray F, Ferlay J, Pisani P. Global cancer statistics, 2002. CA Cancer J Clin. 2005;55:74–108. - PubMed
    1. Shields PG. Molecular epidemiology of lung cancer. Ann Oncol. 1999;10 (Suppl 5):S7–11. - PubMed
    1. Hoffman PC, Mauer AM, Vokes EE. Lung cancer. Lancet. 2000;355:479–85. - PubMed
    1. Postmus PE. Bronchoscopy for lung cancer. Chest. 2005;128:16–8. - PubMed
    1. Mazzone P, Jain P, Arroliga AC, Matthay RA. Bronchoscopy and needle biopsy techniques for diagnosis and staging of lung cancer. Clin Chest Med. 2002;23:137–58. ix. - PubMed

Publication types

MeSH terms

Substances