

Single nucleotide polymorphism-based genome-wide chromosome copy change, loss of heterozygosity, and aneuploidy in Barrett's esophagus neoplastic progression
- PMID: 19138988
- PMCID: PMC2882787
- DOI: 10.1158/1940-6207.CAPR-08-0121
Single nucleotide polymorphism-based genome-wide chromosome copy change, loss of heterozygosity, and aneuploidy in Barrett's esophagus neoplastic progression
Abstract
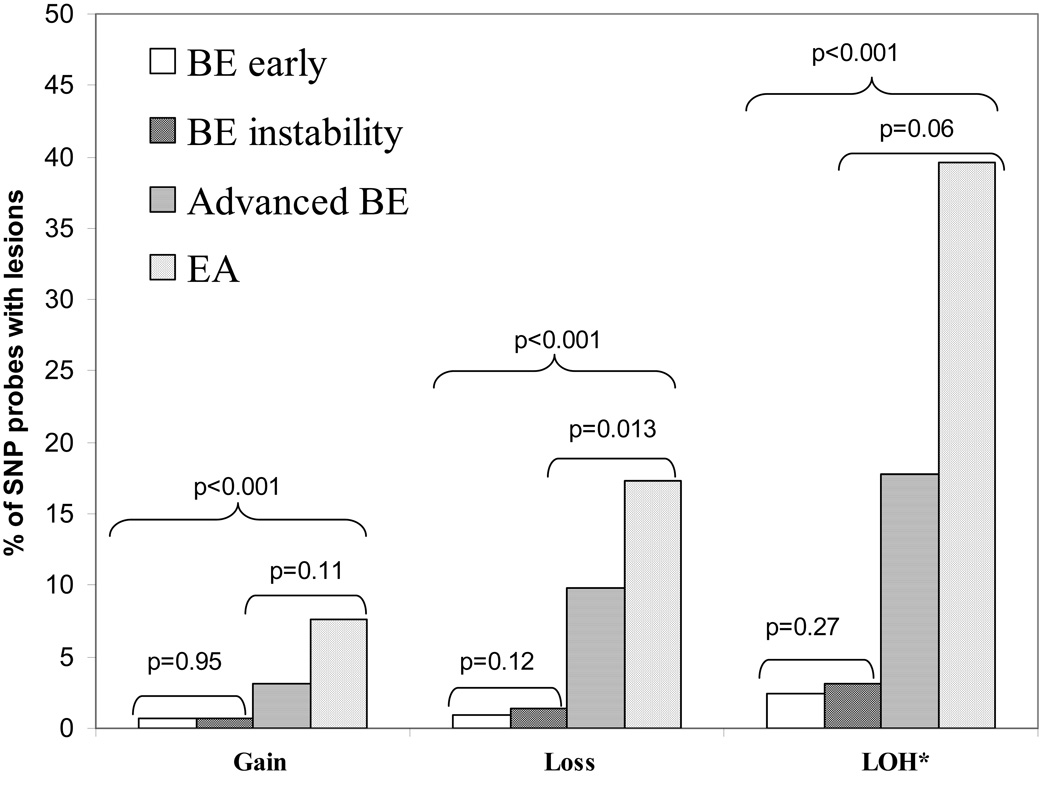
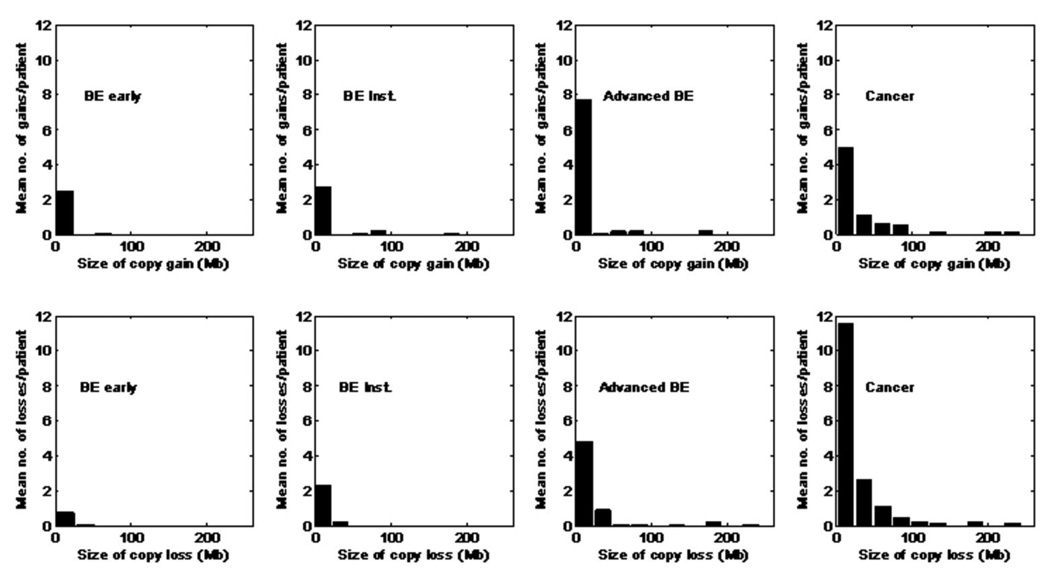
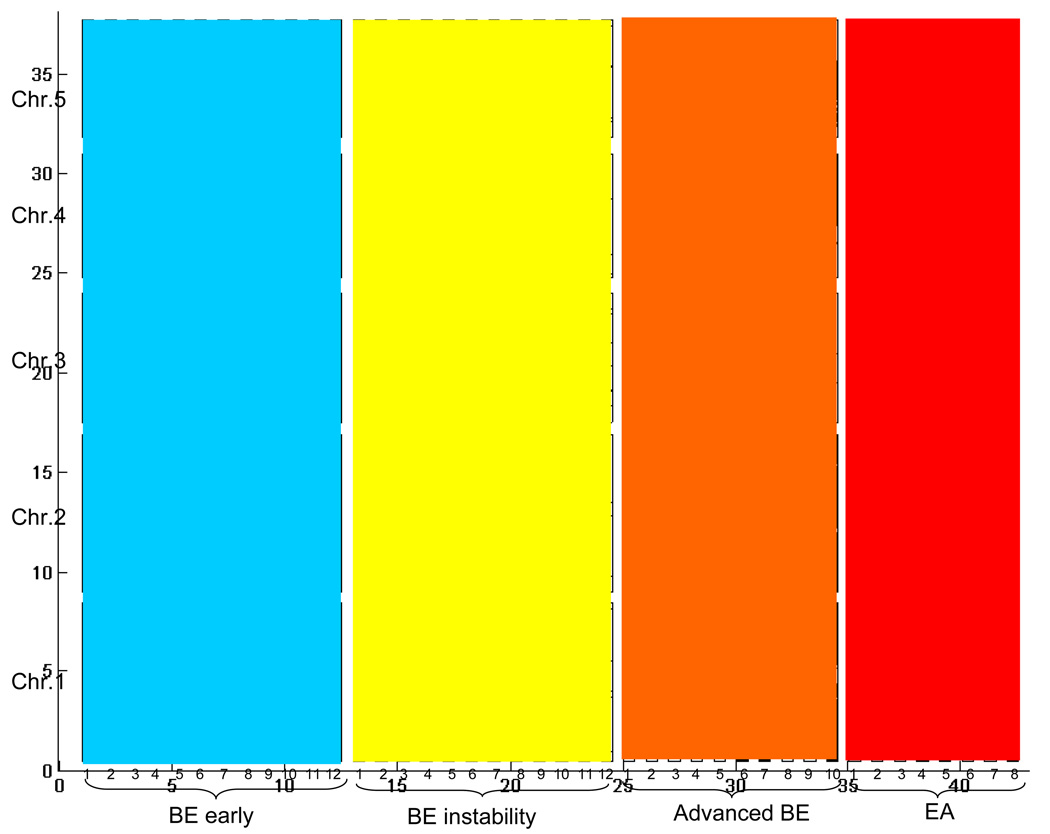
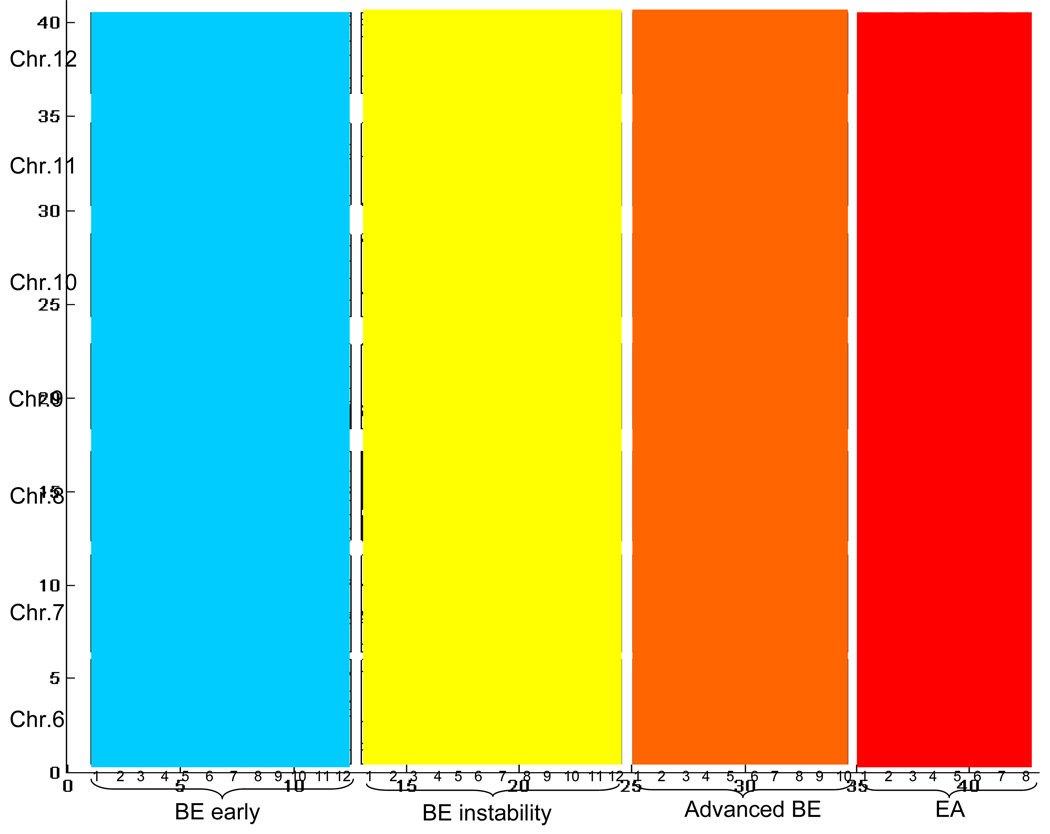
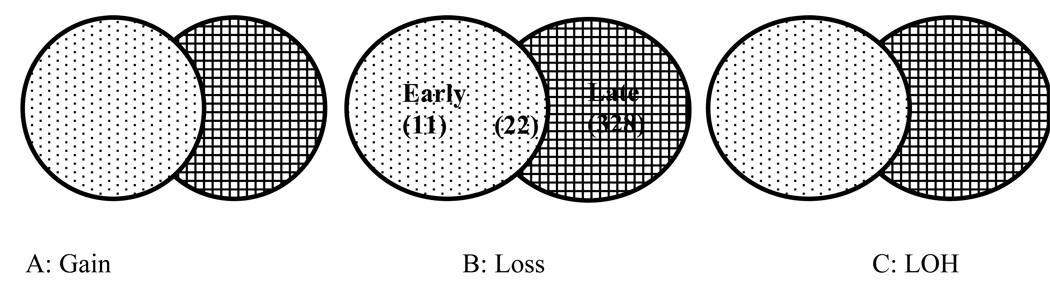
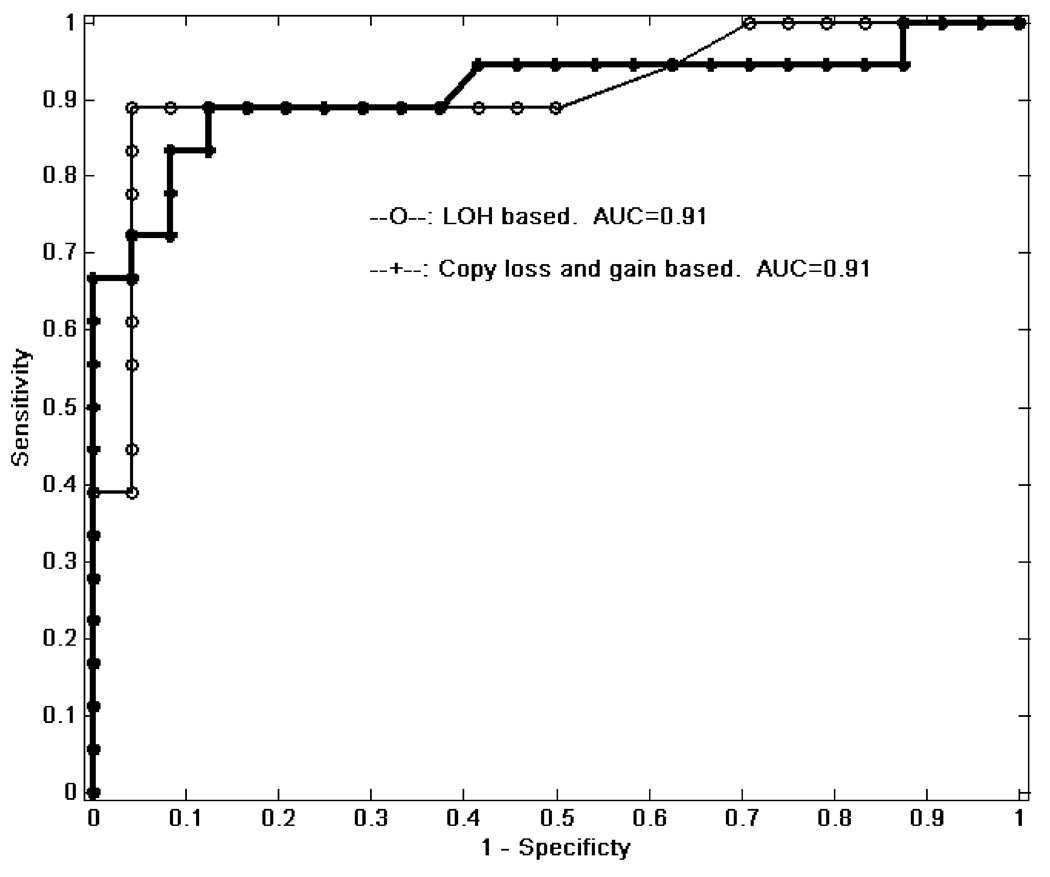
Chromosome copy gain, loss, and loss of heterozygosity (LOH) involving most chromosomes have been reported in many cancers; however, less is known about chromosome instability in premalignant conditions. 17p LOH and DNA content abnormalities have been previously reported to predict progression from Barrett's esophagus (BE) to esophageal adenocarcinoma (EA). Here, we evaluated genome-wide chromosomal instability in multiple stages of BE and EA in whole biopsies. Forty-two patients were selected to represent different stages of progression from BE to EA. Whole BE or EA biopsies were minced, and aliquots were processed for flow cytometry and genotyped with a paired constitutive control for each patient using 33,423 single nucleotide polymorphisms (SNP). Copy gains, losses, and LOH increased in frequency and size between early- and late-stage BE (P < 0.001), with SNP abnormalities increasing from <2% to >30% in early and late stages, respectively. A set of statistically significant events was unique to either early or late, or both, stages, including previously reported and novel abnormalities. The total number of SNP alterations was highly correlated with DNA content aneuploidy and was sensitive and specific to identify patients with concurrent EA (empirical receiver operating characteristic area under the curve = 0.91). With the exception of 9p LOH, most copy gains, losses, and LOH detected in early stages of BE were smaller than those detected in later stages, and few chromosomal events were common in all stages of progression. Measures of chromosomal instability can be quantified in whole biopsies using SNP-based genotyping and have potential to be an integrated platform for cancer risk stratification in BE.
Figures

Comment in
-
Chromosomal deletions and progression of premalignant lesions: less is more.Cancer Prev Res (Phila). 2008 Nov;1(6):404-8. doi: 10.1158/1940-6207.CAPR-08-0177. Cancer Prev Res (Phila). 2008. PMID: 19138986 No abstract available.
References
-
- Nowell PC. The clonal evolution of tumor cell populations. Science. 1976;194:23–28. - PubMed
-
- Nancarrow DJ, Handoko HY, Smithers BM, et al. Genome-wide copy number analysis in esophageal adenocarcinoma using high-density single-nucleotide polymorphism arrays. Cancer Res. 2008;68:4163–4172. - PubMed
-
- Croft J, Parry EM, Jenkins GJ, et al. Analysis of the premalignant stages of Barrett's oesophagus through to adenocarcinoma by comparative genomic hybridization. Eur J Gastroenterol Hepatol. 2002;14:1179–1186. - PubMed
-
- El-Rifai W, Frierson HF, Jr, Moskaluk CA, et al. Genetic differences between adenocarcinomas arising in Barrett's esophagus and gastric mucosa. Gastroenterology. 2001;121:592–598. - PubMed
-
- Moskaluk CA, Hu J, Perlman EJ. Comparative genomic hybridization of esophageal and gastroesophageal adenocarcinomas shows consensus areas of DNA gain and loss. Genes Chromosomes Cancer. 1998;22:305–311. - PubMed
Publication types
MeSH terms
Grants and funding
LinkOut - more resources
Full Text Sources
Other Literature Sources
