. 2009 Apr;37(5):1486-500.
doi: 10.1093/nar/gkn1085. Epub 2009 Jan 12.

Modulation of gene expression in U251 glioblastoma cells by binding of mutant p53 R273H to intronic and intergenic sequences

Affiliations

Modulation of gene expression in U251 glioblastoma cells by binding of mutant p53 R273H to intronic and intergenic sequences

Marie Brázdová et al. Nucleic Acids Res. 2009 Apr.

Abstract

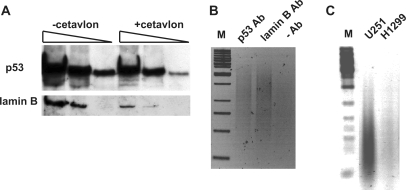
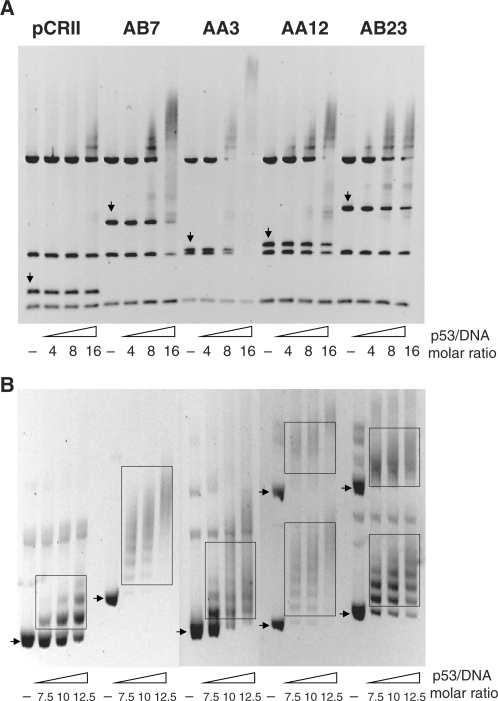
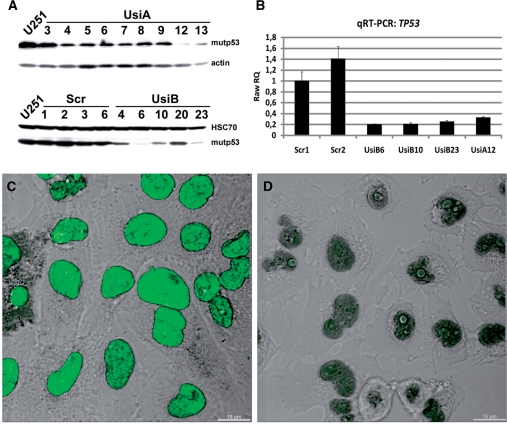
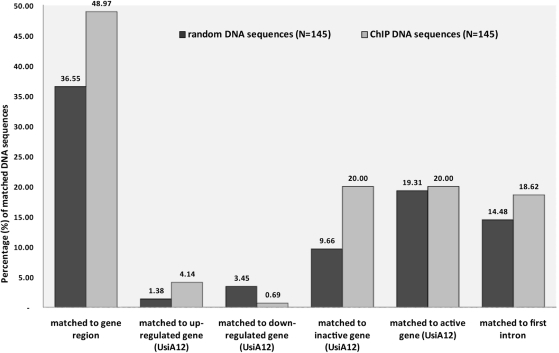
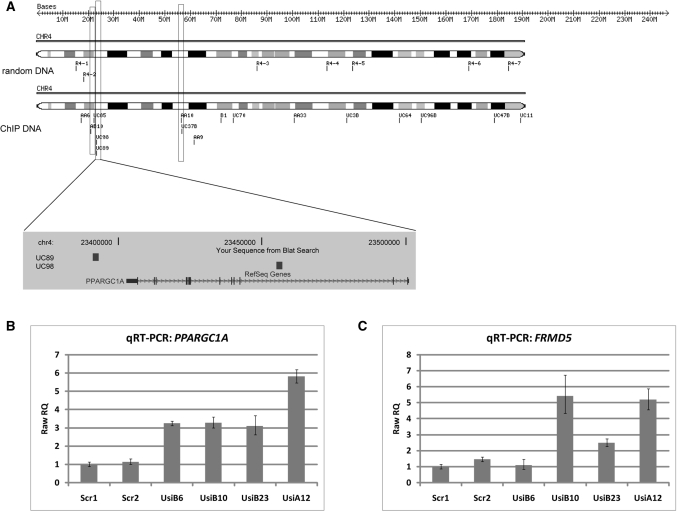
Missense point mutations in the TP53 gene are frequent genetic alterations in human tumor tissue and cell lines derived thereof. Mutant p53 (mutp53) proteins have lost sequence-specific DNA binding, but have retained the ability to interact in a structure-selective manner with non-B DNA and to act as regulators of transcription. To identify functional binding sites of mutp53, we established a small library of genomic sequences bound by p53(R273H) in U251 human glioblastoma cells using chromatin immunoprecipitation (ChIP). Mutp53 binding to isolated DNA fragments confirmed the specificity of the ChIP. The mutp53 bound DNA sequences are rich in repetitive DNA elements, which are dispersed over non-coding DNA regions. Stable down-regulation of mutp53 expression strongly suggested that mutp53 binding to genomic DNA is functional. We identified the PPARGC1A and FRMD5 genes as p53(R273H) targets regulated by binding to intronic and intra-genic sequences. We propose a model that attributes the oncogenic functions of mutp53 to its ability to interact with intronic and intergenic non-B DNA sequences and modulate gene transcription via re-organization of chromatin.


Figures

Figure 1.
Figure 1.
p53R273H is targeted to the nucleus in U251 glioblastoma cells. (A–H) Confocal images of U251 cells stained with anti-p53 (green) and anti-SATB2 (A, B), anti-Sp1 (C, D), anti-YY1 (E, F), and anti-RNA polymerase II (G, H) antibodies (red) according to a standard protocol (A, C, E, G), or extracted with Triton X-100 prior to PFA-fixation (B, D, F, H). Z-stack sections were deconvoluted using the Huygens software and the images were processed with the Imaris software. The co-localization channel (yellow) was generated using the ImarisColoc module. Scale bar—5 µm.
Figure 2.
Figure 2.
Formaldehyde-mediated crosslinking of p53R273H with genomic DNA. (A) Detection of mutp53 and lamin B by immunoblotting in protein–DNA complexes purified from formaldehyde-treated U251 cells. DNA-bound proteins were separated by SDS–PAGE either directly or after treatment with Cetavlon and blotted onto a nitrocellulose membrane. (B) Detection of DNA crosslinked with mutp53 and lamin B by formaldehyde via ChIP and LM–PCR. Amplified DNA was separated by electrophoresis in an agarose gel and stained with ethidium bromide. In the control experiment antibodies were omitted. (C) Demonstration of the specificity of the anti-p53 antibody (FL-393; Santa-Cruz). P53-deficient H1299 cells and U251 cells were treated with formaldehyde. Protein–DNA complexes were subjected to ChIP followed by LM–PCR and agarose gel electrophoresis. M—DNA size marker.
Figure 3.
Figure 3.
Content of repetitive DNA and S/MAR motifs in ChIP and random datasets. (A–B) Nucleotide sequences from the ChIP library, random genomic fragments (2000 nucleotides centered on random positions) and random promoter regions (2-kb upstream of TSS) were analyzed for the presence of repetitive elements and S/MAR motifs using RepeatMasker and Mar-Wiz web-tools, respectively. Although S/MARs are rather defined by functional tests than by sequence motifs, some sequence motifs can help to roughly identify the presence of S/MARs (38). The graphs show the content of each class of repetitive sequences (A) and S/MAR-specific motifs (B) in all groups. Names of the repetitive sequences are marked under the column graph. The content of the major classes of dispersed repetitive sequences is presented: Alu- and MIR-SINE, short interspersed nucleotide element; LINE1, LINE2 and L3/CR1, long interspersed nucleotide element; MaLR, mammalian LTR retrovirus; ERVL, ERV_classI and ERV_classII, endogenous retrovirus repeat family; MER1_type and MER2_type, medium reiteration frequency; simple repeats. The MAR-Wiz tool was operated with its default settings (Ori rule, TG richness rule, curved-DNA rule, kinked-DNA rule, Topo II recognition rule, AT richness).
Figure 4.
Figure 4.
Recombinant p53R273H interacts preferentially with ChIP DNA sequences in vitro. (A–B) Four selected ChIP DNA sequences were tested for their interaction with p53R273H using EMSA. For the binding reaction, either PvuII-restriction fragments of empty or insert containing pCRII vector (A), or supercoiled forms of plasmid DNA (B) were used. Increasing amounts of p53R273H protein (marked by p53/DNA molar ratio) were incubated with 200 ng of PvuII-restriction fragments (A) or supercoiled DNA (B) in binding buffer and then separated in an agarose gel. After staining with ethidium bromide, gels were photographed. Restriction DNA fragments containing the multi-cloning site and inserted ChIP sequences are marked by vertical arrows. Positions of supercoiled forms (monomer and dimer) of plasmid DNA after electrophoretic separation are marked by horizontal arrows. Slowly migrating complexes of p53R273H protein and supercoiled DNA are marked by boxes.
Figure 5.
Figure 5.
Stable reduction of p53R273H expression using shRNA. (A) U251 cells were transfected with vectors encoding either anti-p53 or scrambled shRNA, and after antibiotic selection, single clones (named as UsiA, UsiB and Scr) were tested by immunoblotting for the expression of mutp53. Actin or HSC70 were used as a loading control. (B–D) Reduction of mutp53 expression in UsiA12 cells was validated by qRT–PCR (B) and immunofluorescence microscopy (C–D). (B) For relative quantitation of mutp53 transcription by qRT–PCR, total RNA from U251 clones expressing either scrambled (Scr1 and Scr2) or p53-specific shRNA (UsiA12, UsiB6, UsiB10, UsiB23) was isolated three times. qRT–PCR was done in triplicates. RQ (relative quantitation) values were calculated by normalizing to the transcription of the HPRT1 gene and selecting Scr1 sample as calibrator. (C–D) Confocal images of U251 (C) and UsiA12 cells (D), immunostained with anti-p53 antibody (green). Z-stack sections were deconvoluted using the Huygens software and the images were processed with the Imaris software. 3D reconstructed confocal images were merged with a differential interference contrast (DIC) micrograph to show the cellular outlines and nuclei. Scale bar—15 µm.
Figure 6.
Figure 6.
Correlation of ChIP and expression microarray data. The graph shows the statistic evaluation of chromosomal positions of ChIP and random genomic sequences which were inspected with respect to the coordinates of known genes (UCSC and Refseq gene tracks in Genome Browser, hg18), location in the first intron, transcriptionally regulated genes (up- or down-regulated in UsiA12 cells), and active (‘on’) or inactive (‘off’) gene as judged from the expression microarray data (UsiA12 cells). Ordinate axis represents the percentage of sequences from both groups identified in each analysis.
Figure 7.
Figure 7.
p53R273H binding correlates with the regulation of PPARGC1A gene activity. (A) Chromosomal coordinates of ChIP and random sequences on chromosome 4 were plotted using the ChromoMapper software. Closely linked positions of ChIP sequences in a window of 2 Mb are marked by boxes. Genome browser snapshot shows the location of ChIP sequences in PPARGC1A gene. (BC) Relative quantitation of PPARGC1A (B) and FRMD5 (C) gene transcription by qRT–PCR. Total RNA from cell clones expressing scrambled (Scr1 and Scr2) or p53-specific shRNA (UsiA12, UsiB6, UsiB10, UsiB23) was isolated three times. qRT–PCR was done in triplicates. Raw RQ values were calculated by normalizing to the transcription of the HPRT1 gene and selecting Scr1 cell clone as calibrator.

References

    1. Soussi T, Kato S, Levy PP, Ishioka C. Reassessment of the TP53 mutation database in human disease by data mining with a library of TP53 missense mutations. Hum. Mutat. 2005;25:6–17. - PubMed
    1. Petitjean A, Mathe E, Kato S, Ishioka C, Tavtigian SV, Hainaut P, Olivier M. Impact of mutant p53 functional properties on TP53 mutation patterns and tumor phenotype: lessons from recent developments in the IARC TP53 database. Hum. Mutat. 2007;28:622–629. - PubMed
    1. Petitjean A, Achatz MI, Borresen-Dale AL, Hainaut P, Olivier M. TP53 mutations in human cancers: functional selection and impact on cancer prognosis and outcomes. Oncogene. 2007;26:2157–2165. - PubMed
    1. Ma B, Levine AJ. Probing potential binding modes of the p53 tetramer to DNA based on the symmetries encoded in p53 response elements. Nucleic Acids Res. 2007;35:7733–7747. - PMC - PubMed
    1. Ang HC, Joerger AC, Mayer S, Fersht AR. Effects of common cancer mutations on stability and DNA binding of full-length p53 compared with isolated core domains. J. Biol. Chem. 2006;281:21934–21941. - PubMed

Publication types