

Constitutive JAK3 activation induces lymphoproliferative syndromes in murine bone marrow transplantation models
- PMID: 19139084
- PMCID: PMC2661862
- DOI: 10.1182/blood-2008-06-164368
Constitutive JAK3 activation induces lymphoproliferative syndromes in murine bone marrow transplantation models
Abstract
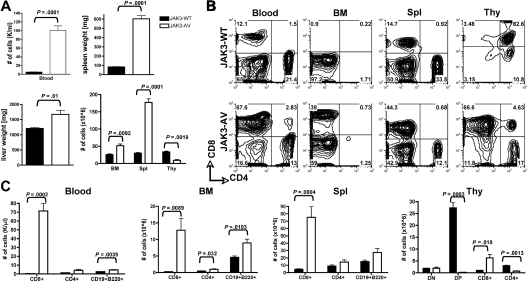
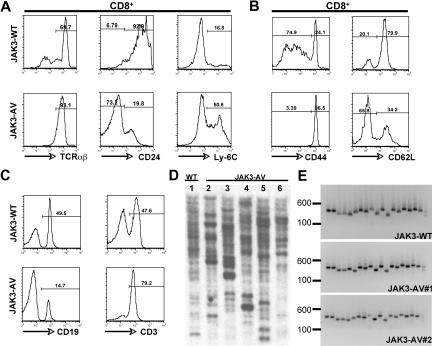
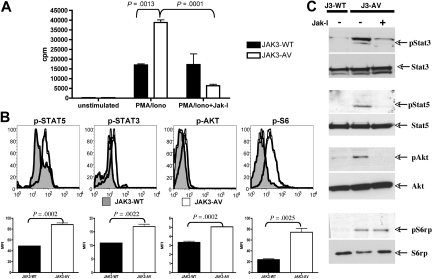
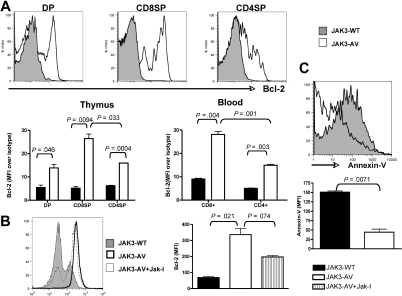
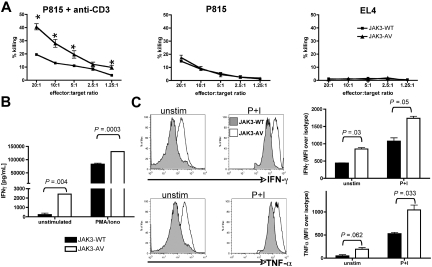
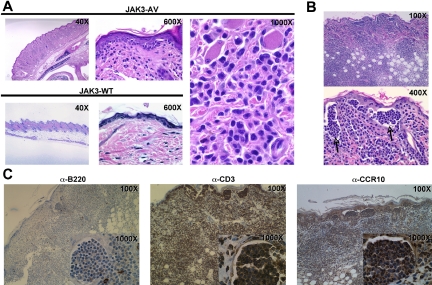
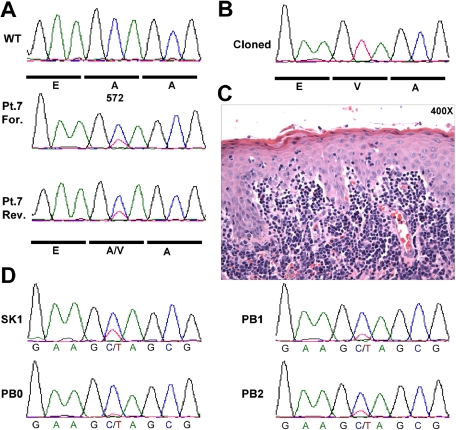
The tyrosine kinase JAK3 plays a well-established role during normal lymphocyte development and is constitutively phosphorylated in several lymphoid malignancies. However, its contribution to lymphomagenesis remains elusive. In this study, we used the newly identified activating JAK3A572V mutation to elucidate the effect of constitutive JAK3 signaling on murine lymphopoiesis. In a bone marrow transplantation model, JAK3A572V induces an aggressive, fatal, and transplantable lymphoproliferative disorder characterized by the expansion of CD8(+)TCRalphabeta(+)CD44(+)CD122(+)Ly-6C(+) T cells that closely resemble an effector/memory T-cell subtype. Compared with wild-type counterparts, these cells show increased proliferative capacities in response to polyclonal stimulation, enhanced survival rates with elevated expression of Bcl-2, and increased production of interferon-gamma (IFNgamma) and tumor necrosis factor-alpha (TNFalpha), correlating with enhanced cytotoxic abilities against allogeneic target cells. Of interest, the JAK3A572V disease is epidermotropic and produces intraepidermal microabscesses. Taken together, these clinical features are reminiscent of those observed in an uncommon but aggressive subset of CD8(+) human cutaneous T-cell lymphomas (CTCLs). However, we also observed a CD4(+) CTCL-like phenotype when cells are transplanted in an MHC-I-deficient background. These data demonstrate that constitutive JAK3 activation disrupts T-cell homeostasis and induces lymphoproliferative diseases in mice.
Figures
Similar articles
-
Partial trisomy 21 contributes to T-cell malignancies induced by JAK3-activating mutations in murine models.Blood Adv. 2018 Jul 10;2(13):1616-1627. doi: 10.1182/bloodadvances.2018016089. Blood Adv. 2018. PMID: 29986854 Free PMC article.
-
Suppressor of cytokine signaling 1 regulates IL-15 receptor signaling in CD8+CD44high memory T lymphocytes.J Immunol. 2003 Sep 1;171(5):2435-45. doi: 10.4049/jimmunol.171.5.2435. J Immunol. 2003. PMID: 12928391
-
Premature terminal differentiation protects from deregulated lymphocyte activation by ITK-Syk.J Immunol. 2014 Feb 1;192(3):1024-33. doi: 10.4049/jimmunol.1300420. Epub 2013 Dec 27. J Immunol. 2014. PMID: 24376268
-
Cutaneous T cell lymphoma: the helping hand of dendritic cells.Ann N Y Acad Sci. 2001 Sep;941:1-11. Ann N Y Acad Sci. 2001. PMID: 11594563 Review.
-
JAK3: a two-faced player in hematological disorders.Int J Biochem Cell Biol. 2009 Dec;41(12):2376-9. doi: 10.1016/j.biocel.2009.09.004. Epub 2009 Sep 9. Int J Biochem Cell Biol. 2009. PMID: 19747563 Free PMC article. Review.
Cited by
-
Tubulosine selectively inhibits JAK3 signalling by binding to the ATP-binding site of the kinase of JAK3.J Cell Mol Med. 2020 Jul;24(13):7427-7438. doi: 10.1111/jcmm.15362. Epub 2020 Jun 17. J Cell Mol Med. 2020. PMID: 32558259 Free PMC article.
-
Mesenchymal stem cells alleviate LPS-induced acute lung injury by inhibiting the proinflammatory function of Ly6C+ CD8+ T cells.Cell Death Dis. 2020 Oct 6;11(10):829. doi: 10.1038/s41419-020-03036-1. Cell Death Dis. 2020. PMID: 33024074 Free PMC article.
-
Genetic alterations of 9p24 in lymphomas and their impact for cancer (immuno-)therapy.Virchows Arch. 2019 Apr;474(4):497-509. doi: 10.1007/s00428-018-2438-6. Epub 2018 Aug 21. Virchows Arch. 2019. PMID: 30132131
-
Genome profiling revealed the activation of IL2RG/JAK3/STAT5 in peripheral T‑cell lymphoma expressing the ITK‑SYK fusion gene.Int J Oncol. 2019 Nov;55(5):1077-1089. doi: 10.3892/ijo.2019.4882. Epub 2019 Sep 20. Int J Oncol. 2019. PMID: 31545408 Free PMC article.
-
A unique case of refractory primary mediastinal B-cell lymphoma with JAK3 mutation and the role for targeted therapy.Haematologica. 2014 Sep;99(9):e156-8. doi: 10.3324/haematol.2014.108142. Epub 2014 May 16. Haematologica. 2014. PMID: 24837469 Free PMC article. No abstract available.
References
-
- Ellisen LW, Bird J, West DC, et al. TAN-1, the human homolog of the Drosophila notch gene, is broken by chromosomal translocations in T lymphoblastic neoplasms. Cell. 1991;66:649–661. - PubMed
-
- Kelly LM, Gilliland DG. Genetics of myeloid leukemias. Annu Rev Genomics Hum Genet. 2002;3:179–198. - PubMed
-
- de Klein A, van Kessel AG, Grosveld G, et al. A cellular oncogene is translocated to the Philadelphia chromosome in chronic myelocytic leukaemia. Nature. 1982;300:765–767. - PubMed
Publication types
MeSH terms
Substances
Grants and funding
LinkOut - more resources
Full Text Sources
Other Literature Sources
Molecular Biology Databases
Research Materials
Miscellaneous
