. 2009 Feb 1;122(Pt 3):389-400.
doi: 10.1242/jcs.037051. Epub 2009 Jan 12.

EHD3 regulates early-endosome-to-Golgi transport and preserves Golgi morphology

Affiliations

EHD3 regulates early-endosome-to-Golgi transport and preserves Golgi morphology

Naava Naslavsky et al. J Cell Sci. .

Abstract

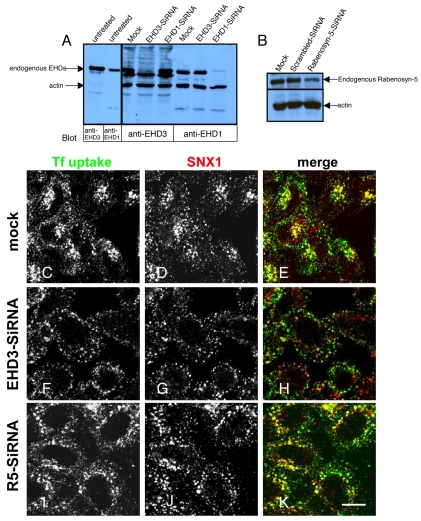
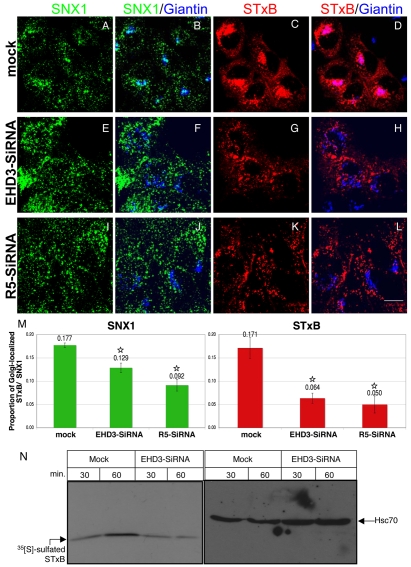
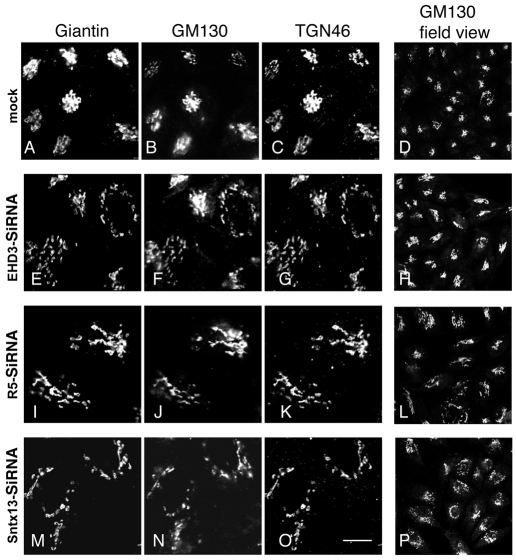
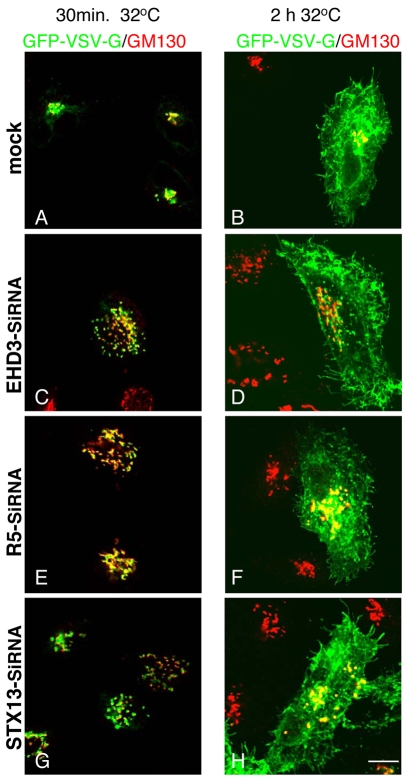
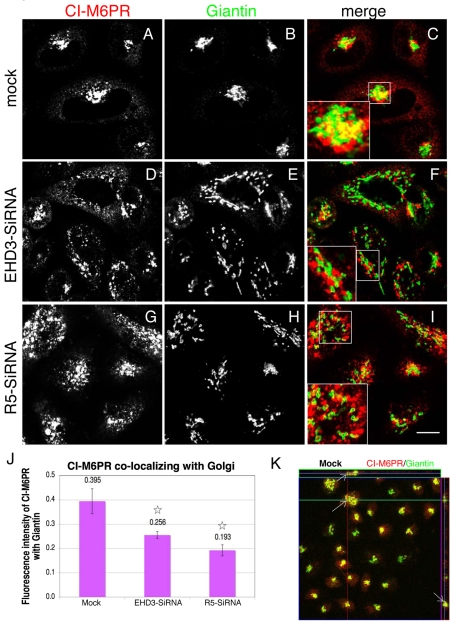
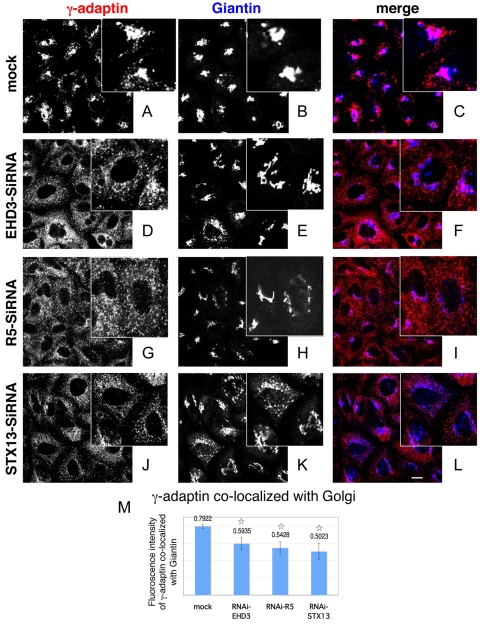
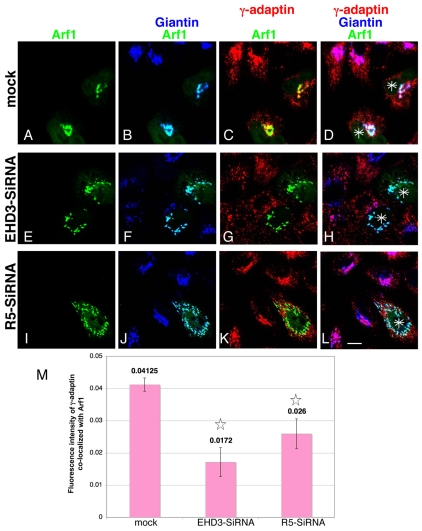
Depletion of EHD3 affects sorting in endosomes by altering the kinetics and route of receptor recycling to the plasma membrane. Here we demonstrate that siRNA knockdown of EHD3, or its interaction partner rabenosyn-5, causes redistribution of sorting nexin 1 (SNX1) to enlarged early endosomes and disrupts transport of internalized Shiga toxin B subunit (STxB) to the Golgi. Moreover, under these conditions, Golgi morphology appears as a series of highly dispersed and fragmented stacks that maintain characteristics of cis-, medial- and trans-Golgi membranes. Although Arf1 still assembled onto these dispersed Golgi membranes, the level of AP-1 gamma-adaptin recruited to the Golgi was diminished. Whereas VSV-G-secretion from the dispersed Golgi remained largely unaffected, the distribution of mannose 6-phosphate receptor (M6PR) was altered: it remained in peripheral endosomes and did not return to the Golgi. Cathepsin D, a hydrolase that is normally transported to lysosomes via an M6PR-dependent pathway, remained trapped at the Golgi. Our findings support a role for EHD3 in regulating endosome-to-Golgi transport, and as a consequence, lysosomal biosynthetic, but not secretory, transport pathways are also affected. These data also suggest that impaired endosome-to-Golgi transport and the resulting lack of recruitment of AP-1 gamma-adaptin to Golgi membranes affect Golgi morphology.


Figures

Fig. 1.
Fig. 1.
SNX1 is retained in enlarged early endosomes upon knockdown of EHD3 or rabenosyn-5. (A) HeLa cells were subjected to mock or siRNA treatment for 48 hours to knock down EHD3 or EHD1. The two left lanes are lysate of untreated HeLa cells, denoting the size of the corresponding endogenous proteins, as detected by specific antibodies. (B) HeLa cells were mock-treated or treated with siRNA for 48 hours to knock down endogenous rabenosyn-5 (R5). In both immunoblots, equal amounts of protein from each sample were run on SDS-PAGE and immunoblotted with polyclonal anti-rabenosyn-5. Actin was used in all gels as a control for protein content. (C-E) Mock-treated cells, (F-H) EHD3 siRNA-treated cells and (I-K) rabenosyn-5 siRNA-treated cells were starved for 30 minutes and allowed to internalize Alexa Fluor 488-conjugated-Tf for 7 minutes, followed by a `chase' of 8 minutes (37°C) in complete medium. After fixation, immunostaining of endogenous SNX1 was performed with a monoclonal antibody followed by Alexa Fluor 568 goat-anti mouse secondary antibody. Scale bar: 10 μm.
Fig. 2.
Fig. 2.
Depletion of EHD3 or rabenosyn-5 traps internalized STxB in endosomes and delays its progression to the Golgi. HeLa cells were mock treated (A-D) or treated with siRNA for 48 hours to reduce EHD3 (E-H) or rabenosyn-5 (R5) (I-L). 546-STxB was bound to cells on ice (30 minutes) and uptake was accomplished by shifting the cells to 37°C in complete medium for an additional 35 minutes. After fixation, endogenous SNX1 and giantin were co-stained with their respective antibodies, followed by Alexa Fluor 488 goat anti-mouse and Alexa Fluor 405 goat anti-rabbit, respectively. (M) The colocalization of SNX1 at the Golgi is shown in a quantitative analysis (left graph shows results from B,F,J). Likewise, the influx of STxB into the Golgi is summarized in M (right graph shows results from D,H,L). *P<0.01. (N) Sulfation analysis of the STxB variant as a measure of its arrival at the TGN. Sulfation-site-tagged STxB was allowed to bind to mock-treated and EHD3 siRNA-treated cells on ice. Cells were then shifted to 37°C in sulfate-free medium containing [35S]sulphate for 30 and 60 minutes. Samples were immunoprecipitated with anti STxB (right blot). The same samples were precipitated with TCA and immunoblotted with anti-Hsc70 to show equivalent loading in each lane (left blot). Overall sulfation levels of cellular proteins remained largely unchanged (data not shown). Scale bar: 10 μm.
Fig. 3.
Fig. 3.
Golgi stacks undergo morphological alterations upon knockdown of EHD3, rabenosyn-5 and Syntaxin13, but retain cis- and trans-Golgi markers. Mock-treated HeLa cells (A-D), or siRNA treatment for EHD3 (E-H), rabenosyn-5 (I-L) or STX13 (M-P) were fixed and permeabilized. Cis and medial Golgi was visualized with mouse anti-GM130 and rabbit anti-giantin and the trans Golgi was detected with sheep anti-TGN46. Secondary antibodies were: Alexa Fluor 405 goat anti-mouse, Alexa Fluor 488 goat anti-rabbit and Cy3 donkey anti-sheep, respectively). D, H, L and P are field views of cells stained with anti-GM130. Scale bar, 10 μm.
Fig. 4.
Fig. 4.
EHD3 depletion does not impair the secretory route of VSV-G from vesiculated Golgi to the plasma membrane. HeLa cells were transfected with the temperature-sensitive GFP-VSV-G and concurrently mock treated (A,B) and siRNA treated to knock down EHD3 (C,D), rabenosyn-5 (R5) (E,F) or STX13 (G,H) for 48 hours. In the last 18 hours the cells were shifted to 40°C, leading to accumulation of GFP-VSV-G in the endoplasmic reticulum. To induce transport of GFP-VSV-G into the Golgi, cells were then transferred to 32°C for 30 minutes and fixed (A,C,E,G). To allow transport via the secretory pathway from the Golgi to the plasma membrane, cells were kept at 32°C for an additional 2 hours (B,D,F,H). Golgi cisternae were detected with anti-GM130 (in red). Scale bar, 10 μm.
Fig. 5.
Fig. 5.
Depletion of EHD3 or rabenosyn-5 causes impaired biosynthetic transport of cathepsin-D to lysosomes. HeLa cells, transfected with GFP-lgp120, were mock treated (A-G) or treated with EHD3 siRNA (H-K) or rabenosyn-5 (L-O) for 48 hours before fixation. TGN was detected with rabbit anti-TGN46 followed by Alexa Fluor 405-conjugated goat anti-rabbit. Anti-cathepsin-D was used to visualize endogenous cathepsin-D, followed by Alexa Fluor 568-conjugated goat anti-mouse. A-C are single-stain images of a mock-treated cell. Triple-stained images are split into pairs of colors to facilitate visualization of the distribution patterns, with the corresponding merged images (G,K,O). The graphs in P are a quantitative analysis of colocalization (see Materials and Methods) between cathepsin-D and GFP-lgp120 (left graph, representing E, I and M), whereas the right graph quantifies the colocalization of cathepsin-D with TGN46, representing F, J and N. *P<0.01 compared with mock-treated cells. (Q) Mock- and EHD3-siRNA-treated HeLa cells were pulsed with [35S]cysteine/methionine and chased for the indicated times. The cells were lysed, and immunoprecipitated with anti-cathepsin D antibody. At the 5 hour time point, the entire supernatant was collected and immunoprecipitated with anti-cathepsin-D, to detect levels of mis-sorted cathepsin D that has been secreted from the TGN. Samples were separated by SDS-PAGE prior to exposure of the gels to autoradiograhic film. (R) Levels of cathepsin-D precursor bands were quantified by densitometry from the representative gel displayed in Q. Scale bar: 10 μm.
Fig. 6.
Fig. 6.
Depletion EHD3 and rabenosyn-5 cause impaired mannose-6-phosphate receptor retrieval to the Golgi. Mock-(A-C and K), EHD3 siRNA (D-F) or rabenosyn-5 siRNA-treated cells (G-I) were fixed and stained with antibodies against the cation-independent mannose 6-phosphate receptor (CI-M6PR) and giantin, followed by Alexa Fluor 568 goat anti-mouse and Alexa Fluor 488 goat anti-rabbit secondary antibodies, respectively. Insets depict co-staining for CI-M6PR and giantin. Colocalization of CI-M6PR and giantin is quantified in J and represents 70-90 cells (see Materials and Methods). *P<0.01 compared with mock-treated controls. (K) Z-section analysis was performed to assess three-dimensional colocalization between CI-M6PR and giantin in mock-treated cells. Arrows denote specific puncta at the Golgi, whose colocalization is analyzed in three dimensions. The green horizontal line in the image represents the slice that was analyzed, shown to the right of the image as the z-axis. The slice above the image represents the x-y axis. In both slices, a middle line is seen, representing the actual focal plane for this image. Scale bar: 10 μm.
Fig. 7.
Fig. 7.
Depletion of EHD3, rabenosyn-5 (R5) or STX13 leads to diminished recruitment of γ-adaptin to fragmented Golgi complexes. Mock-treated (A-C) and siRNA-treated (D-L) cells were fixed and stained with mouse anti-γ-adaptin (red) and giantin (blue). Note the differences in the pattern of γ-adaptin in mock-treated compared with siRNA-treated cells (insets). The merged images facilitate visualization of colocalization observed in mock (pink) compared with a distinct red and blue pattern in siRNA-treated cells. (M) 70-90 cells from each sample from the above experiment (A-L) were assessed for colocalization of γ-adaptin and giantin. Values above bars give fluorescence intensity. *P<0.01 compared with mock-treated cells. Scale bar: 10 μm.
Fig. 8.
Fig. 8.
Dissociation between Arf1 and γ-adaptin upon knockdown of EHD3 or rabenosyn-5. GFP-Arf1-transfected HeLa cells were treated with EHD3 siRNA (E-H) or rabenosyn-5 siRNA (R5-siRNA) (I-L), or left untreated (A-D) for 48 hours. After fixation, endogenous γ-adaptin and giantin were stained with specific antibodies, followed by Alexa Fluor 568 goat anti-mouse and Alexa Fluor 405 goat anti-rabbit, respectively. The triple-colored images are presented here as follows: GFP-Arf1 only (A,E,I); GFP-Arf1 and giantin (B,F,J; light blue represents their colocalization); GFP-Arf1 and γ-adaptin (C,G,K; yellow depicts their colocalization); merge of all three colors (D,H,L; white is the merge of the three colors; asterisks depict the GFP-Arf1 transfected cells). (M) The bar graph represents a quantitative analysis of 70-90 cells per sample from the experiment above, measuring the colocalization between γ-adaptin and GFP-Arf1 (bars represent results from C,G,K). *P<0.01 compared with mock-treated cells. Scale bar: 10 μm.

Similar articles

Cited by

References

    1. Advani, R. J., Bae, H. R., Bock, J. B., Chao, D. S., Doung, Y. C., Prekeris, R., Yoo, J. S. and Scheller, R. H. (1998). Seven novel mammalian SNARE proteins localize to distinct membrane compartments. J. Biol. Chem. 273, 10317-10324. - PubMed
    1. Amessou, M., Fradagrada, A., Falguieres, T., Lord, J. M., Smith, D. C., Roberts, L. M., Lamaze, C. and Johannes, L. (2007). Syntaxin 16 and syntaxin 5 are required for efficient retrograde transport of several exogenous and endogenous cargo proteins. J. Cell Sci. 120, 1457-1468. - PMC - PubMed
    1. Blume, J. J., Halbach, A., Behrendt, D., Paulsson, M. and Plomann, M. (2007). EHD proteins are associated with tubular and vesicular compartments and interact with specific phospholipids. Exp. Cell Res. 313, 219-231. - PubMed
    1. Bolte, S. and Cordelieres, F. P. (2006). A guided tour into subcellular colocalization analysis in light microscopy. J. Microsc. 224, 213-232. - PubMed
    1. Bonifacino, J. S. and Rojas, R. (2006). Retrograde transport from endosomes to the trans-Golgi network. Nat. Rev. Mol. Cell. Biol. 7, 568-579. - PubMed

Publication types

MeSH terms