. 2009 Mar 13;284(11):6998-7006.
doi: 10.1074/jbc.M807670200. Epub 2009 Jan 12.

A positive regulatory role for the mSin3A-HDAC complex in pluripotency through Nanog and Sox2

Affiliations

A positive regulatory role for the mSin3A-HDAC complex in pluripotency through Nanog and Sox2

Gretchen A Baltus et al. J Biol Chem. .

Abstract

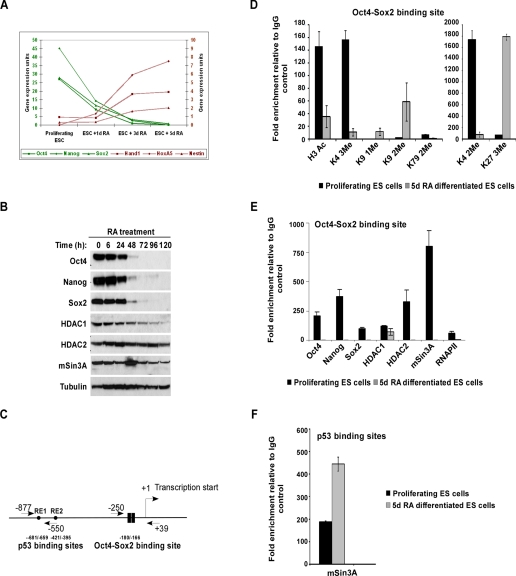
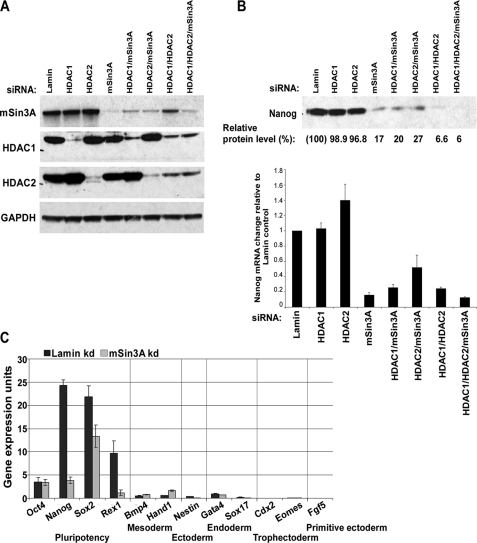
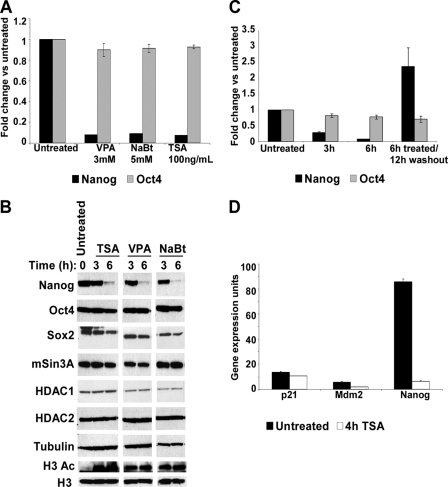
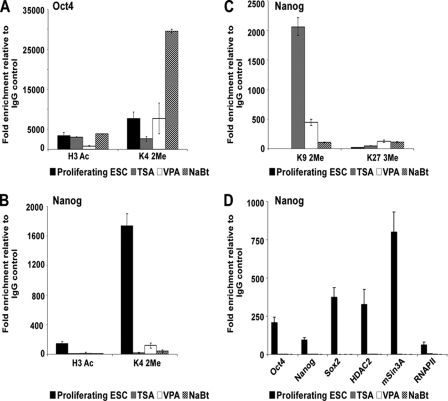
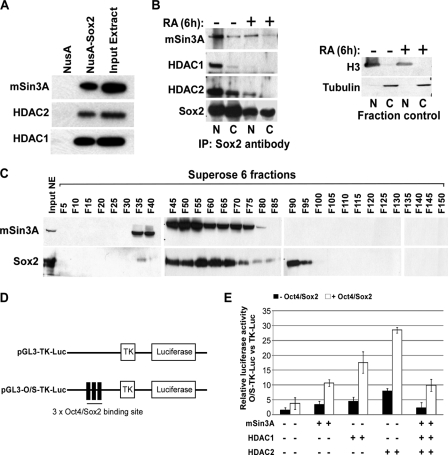
Large networks of proteins govern embryonic stem (ES) cell pluripotency. Recent analysis of the critical pluripotency factors Oct4 and Nanog has identified their interaction with multiple transcriptional repression complexes, including members of the mSin3A-HDAC complex, suggesting that these factors could be involved in the regulation of Oct4/Nanog function. mSin3A is critical for embryonic development, but the mechanism by which the mSin3A-HDAC complex is able to regulate ES cell pluripotency is undefined. Herein we show that the mSin3A-HDAC complex positively regulates Nanog expression in ES cells through Sox2, a critical ES cell transcription factor and regulator of Nanog. We have identified the mSin3A-HDAC complex to be present at the Nanog promoter only under proliferating conditions concurrent with histone acetylation. We find that Sox2 associates with mSin3A-HDAC complex members both in vitro and in vivo, similar to the interactions found between Oct4/Nanog and the mSin3A-HDAC complex. Knockdown of mSin3A-HDAC complex members or HDAC inhibitor treatment reduces Nanog expression, and overexpression of mSin3A-HDAC complex subunits stimulates Nanog expression. Our data demonstrate that the mSin3A-HDAC complex can positively regulate Nanog expression under proliferating conditions and that this activity is complementary to mSin3A-mediated p53-dependent silencing of Nanog during differentiation.


Figures

FIGURE 1.
FIGURE 1.
Recruitment of the mSin3A-HDAC complex to the Nanog promoter during ES cell proliferation. A, qPCR analysis of ES cells in the presence of 5 μm retinoic acid (RA) showing a decrease in pluripotency markers Oct4, Nanog, and Sox2 and an increase in lineage markers Hand1, HoxA5, and Nestin. B, Western blot showing levels of Oct4, Nanog, Sox2, HDAC1, HDAC2, and mSin3A upon RA treatment (5 μm). Tubulin was used as a loading control. C, schematic of the proximal Nanog promoter showing positions of Oct4-Sox2 and p53 binding sites relative to the transcription start site. Arrows denote location of primers used for chromatin immunoprecipitation (ChIP) relative to the transcription start site.D and E, ChIP assays were performed for histone modifications, transcription factors, and deacetylase complex members as indicated using protein extracts of proliferating and 5-day RA-treated ES cells, with primers amplifying the Oct4-Sox2 binding site of the Nanog promoter. Values are expressed as -fold enrichment relative to IgG control ChIP. Results shown are the average of three independent PCR reactions. F, ChIP from proliferating and 5-day RA-treated ES cells using antibodies to mSin3A with primers amplifying the p53 binding site of the Nanog promoter.
FIGURE 2.
FIGURE 2.
RNA interference knockdown of mSin3A-HDAC complex members affects Nanog expression without inducing differentiation. A, Western blot showing levels of mSin3A, HDAC1, and HDAC2 proteins in siRNA-treated ES cells. Lamin siRNA was used as a negative control. Glyceraldehyde-3-phosphate dehydrogenase was used as a loading control. B, levels of Nanog protein (top) and mRNA (bottom) in response to knockdown of mSin3A and associated HDAC members; 96 h after indicated siRNA treatment. Relative protein levels were quantified by image densitometry. Values for Nanog mRNA and protein were normalized to Lamin siRNA. C, mRNA expression levels of pluripotency-related genes (Oct4, Nanog, Sox2, and Rex1), mesodermal lineage markers (Bmp4 and Hand1), ectodermal lineage marker (Nestin), endodermal lineage markers (Gata4 and Sox17), trophectodermal lineage markers (Cdx2 and Eomes), and primitive ectoderm lineage (Fgf5) after siRNA treatment for Lamin (control) or mSin3A.
FIGURE 3.
FIGURE 3.
HDAC inhibitors reduce Nanog gene expression. A, qPCR analysis of Nanog and Oct4 gene expression in the presence of valproic acid (VPA), sodium butyrate (NaBt), and trichostatin A (TSA) for 6 h expressed as -fold change over those untreated. B, Western blot showing levels of Nanog, Oct4, Sox2, mSin3A, HDAC1, and HDAC2 protein levels in the presence of TSA, valproic acid, and sodium butyrate for the times indicated. Total acetylated histone H3 levels were analyzed using H3Ac-specific antibodies as a positive control for HDAC inhibitor treatment. Tubulin and total histone H3 were used as loading controls. C, qPCR analysis of Nanog and Oct4 mRNA in the presence of 100 ng/ml TSA expressed as -fold change over those untreated. Duration of treatment and washout is indicated at the bottom. D, qPCR analysis of Nanog, p21, and Mdm2 mRNA in the presence of 100 ng/ml TSA for 4 h expressed as gene expression units relative to glyceraldehyde-3-phosphate dehydrogenase.
FIGURE 4.
FIGURE 4.
Analysis of Nanog and Oct4 promoters in the presence of HDAC inhibitors. A and B, ChIP analysis for active histone modifications (H3 Ac and H3 K4 2Me) at the Oct4 (A) and Nanog (B) promoters in the presence of HDAC inhibitors. C, ChIP analysis for repressive histone modifications (H3 K9 2Me and H3 K27 3Me) at the Nanog promoter in the presence of HDAC inhibitors. D, ChIP analysis for transcription and chromatin modifying factors at the Nanog promoter in the presence of HDAC inhibitors.
FIGURE 5.
FIGURE 5.
The mSin3A-HDAC complex interacts with Sox2 to cooperatively stimulate Nanog transcription. A, in vitro NusA-Sox2 pulldown from ES cell nuclear extract. mSin3A-HDAC complex subunits were detected by Western blot. B, immunoprecipitation of endogenous Sox2 from nuclear and cytoplasmic fractions of ES cells treated for 6 h with 5 μm RA or vehicle. mSin3A-HDAC complex subunits were detected by Western blot using the indicated antibodies. Western blots for H3 and tubulin indicate the purity of the fractions. C, fractionation of ES cell nuclear extract. Western blots of every fifth fraction indicate that mSin3A and Sox2 are present in majority of the same fractions. D, schematic diagram of the pGL3-TK-Luc and pGL3-O/S-TK-Luc constructs. pGL3-TK-Luc has luciferase driven by the TK promoter. pGL3-O/S-TK-Luc contains three tandem copies of the Oct4-Sox2 binding site from the Nanog promoter inserted upstream of the TK promoter. E, increase in luciferase activity by the addition of Oct4/Sox2, and mSin3A-HDAC complex members. The graph represents the -fold increase in luciferase activity between pGL3-O/S-TK-Luc and pGL3-TK-Luc after adding the indicated factors.

References

    1. Johnson, B. V., Rathjen, J., and Rathjen, P. D. (2006) Curr. Opin. Genet. Dev. 16 447-454 - PubMed
    1. Masui, S., Nakatake, Y., Toyooka, Y., Shimosato, D., Yagi, R., Takahashi, K., Okochi, H., Okuda, A., Matoba, R., Sharov, A. A., Ko, M. S., and Niwa, H. H. (2007) Nat. Cell Biol. 9 625-635 - PubMed
    1. Kuroda, T., Tada, M., Kubota, H., Kimura, H., Hatano, S. Y., Suemori, H., Nakatsuji, N., and Tada, T. (2005) Mol. Cell Biol. 25 2475-2485 - PMC - PubMed
    1. Rodda, D. J., Chew, J. L., Lim, L. H., Loh, Y. H., Wang, B., Ng, H. H., and Robson, P. (2005) J. Biol. Chem. 280 24731-24737 - PubMed
    1. Wu, Q., Chen, X., Zhang, J., Loh, Y. H., Low, T. Y., Zhang, W., Zhang, W., Sze, S. K., Lim, B., and Ng, H. H. (2006) J. Biol. Chem. 281 24090-24094 - PubMed

MeSH terms