Comparative Study
. 2009 Mar 27;284(13):8369-81.
doi: 10.1074/jbc.M806113200. Epub 2009 Jan 12.

The Isopeptidase Inhibitor G5 Triggers a Caspase-independent Necrotic Death in Cells Resistant to Apoptosis: A COMPARATIVE STUDY WITH THE PROTEASOME INHIBITOR BORTEZOMIB

Affiliations
Comparative Study

The Isopeptidase Inhibitor G5 Triggers a Caspase-independent Necrotic Death in Cells Resistant to Apoptosis: A COMPARATIVE STUDY WITH THE PROTEASOME INHIBITOR BORTEZOMIB

Alessandra Fontanini et al. J Biol Chem. .

Abstract

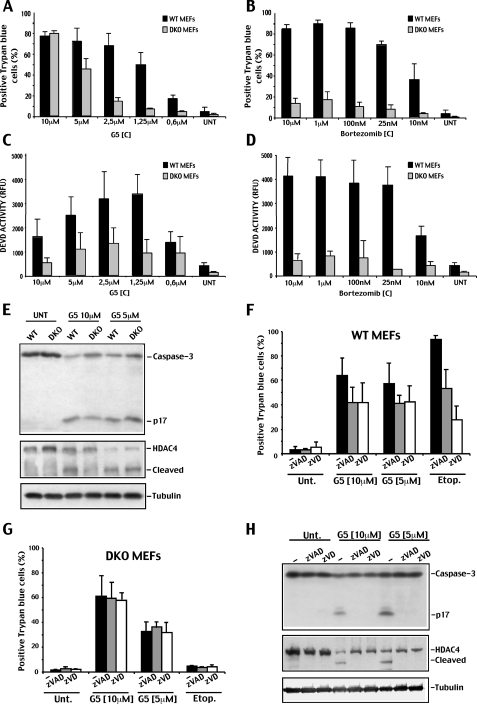
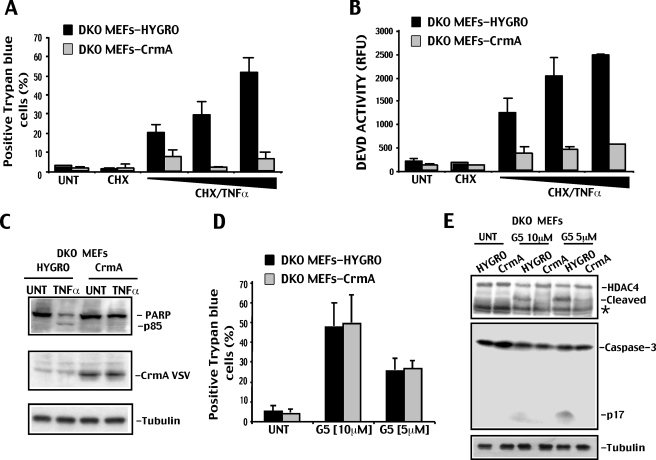
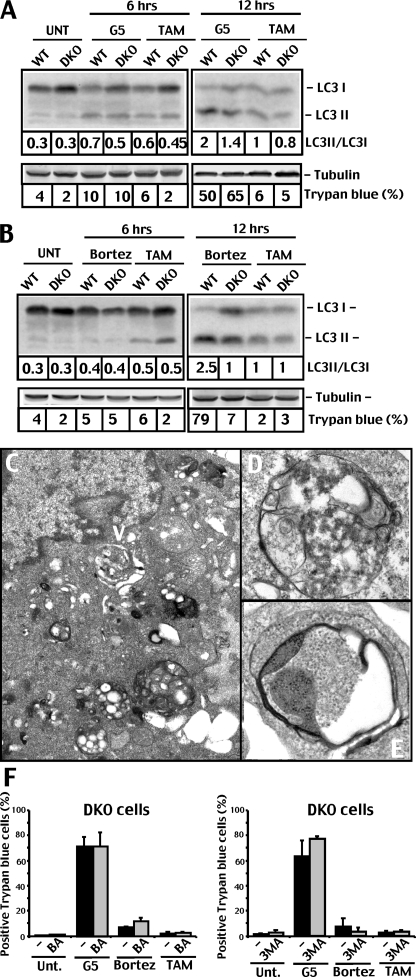
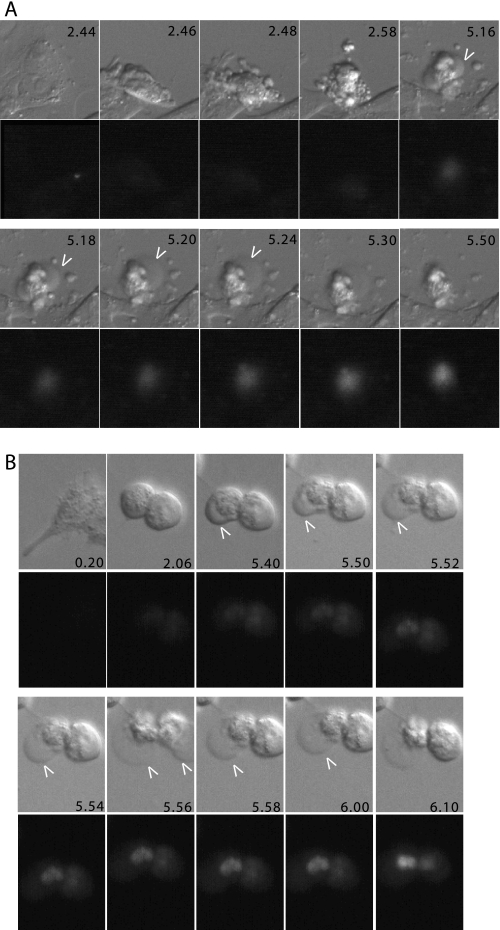
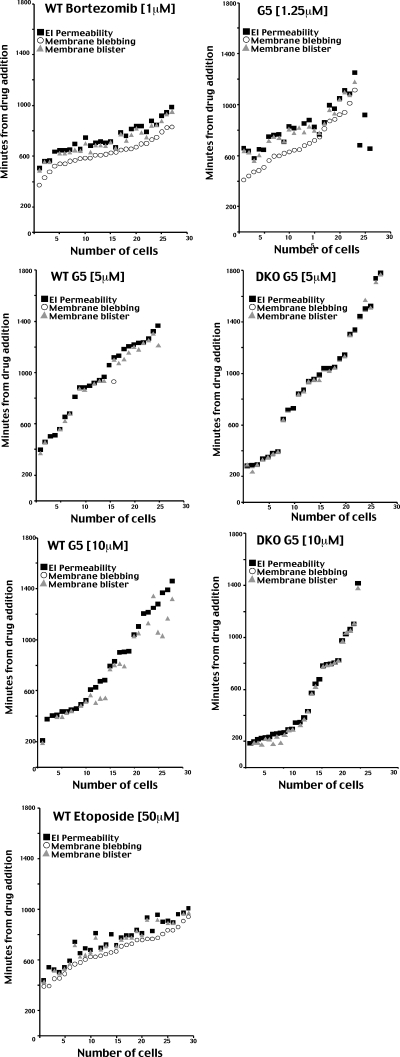
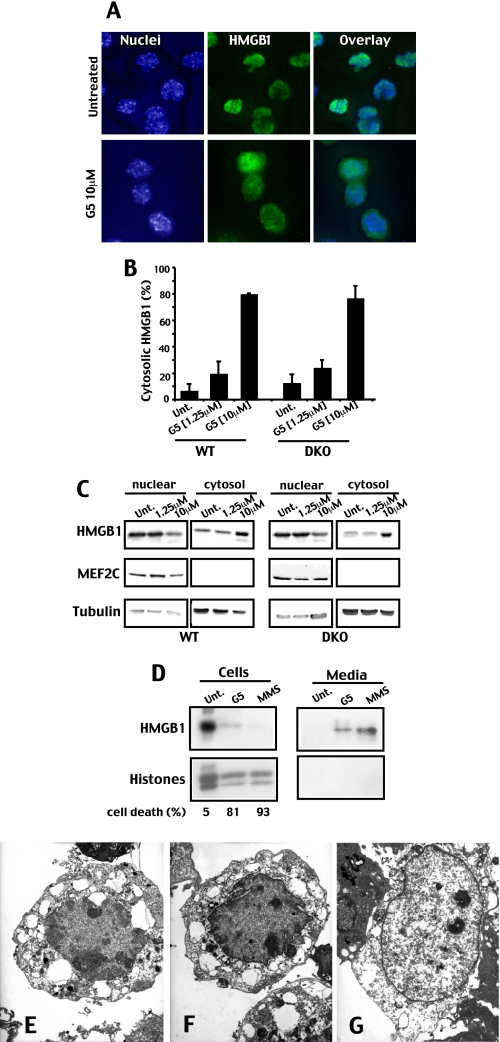
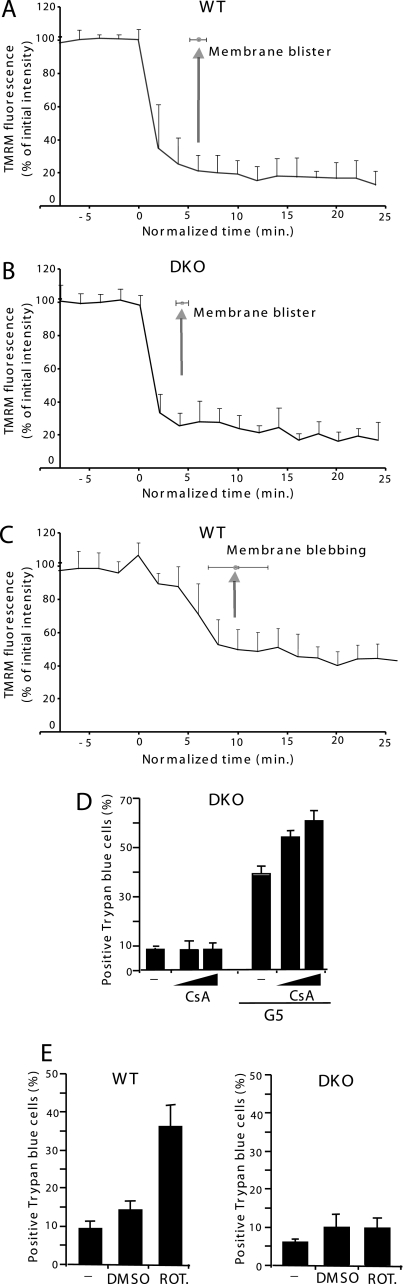
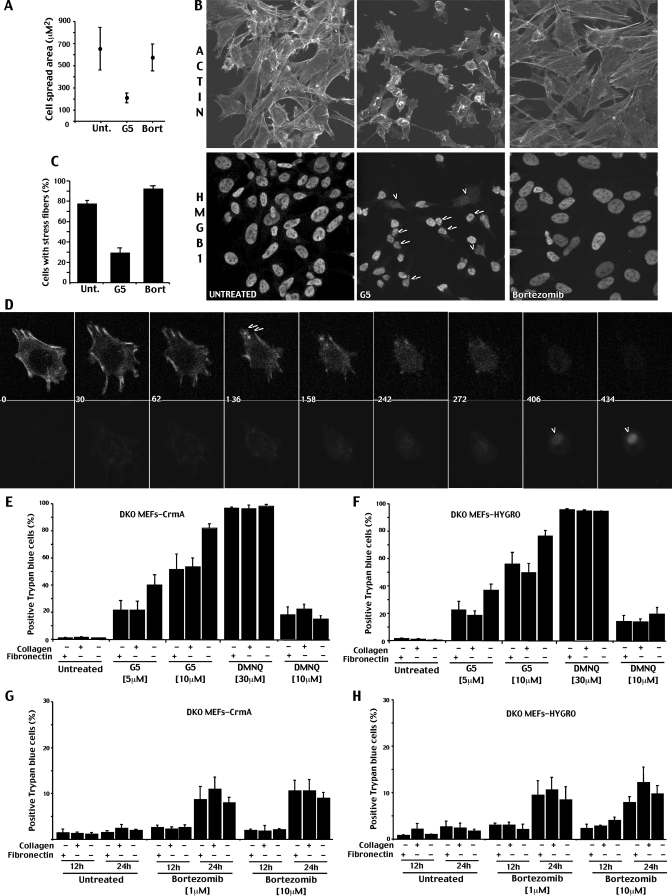
Inhibitors of the ubiquitin-proteasome system (UPSIs) promote apoptosis of cancer cells and show encouraging anti-tumor activities in vivo. In this study, we evaluated the death activities of two different UPSIs: bortezomib and the isopeptidase inhibitor G5. To unveil whether these compounds elicit different types of death, we compared their effect both on apoptosis-proficient wild type mouse embryo fibroblasts and on cells defective for apoptosis (double-deficient Bax/Bak mouse embryo fibroblasts) (double knockout; DKO). We have discovered that (i) both inhibitors induce apoptosis in a Bax and Bak-dependent manner, (ii) both inhibitors elicit autophagy in WT and DKO cells, and (iii) only G5 can kill apoptosis-resistant DKO cells by activating a necrotic response. The induction of necrosis was confirmed by different experimental approaches, including time lapse analysis, HMGB1 release, and electron microscopy studies. Neither treatment with antinecrotic agents, such as antioxidants, poly(ADP-ribose) polymerase and JNK inhibitors, necrostatin, and the intracellular Ca(2+) chelator, 1,2-bis(2-aminophenoxy)ethane-N,N,N',N'-tetraacetic acid acetoxymethyl ester, nor overexpression of Bcl-2 and Bcl-xL prevented necrosis induced by G5. This necrotic death is characterized by the absence of protein oxidation and by the rapid cyclosporin A-independent dissipation of the mitochondrial membrane potential. Notably, a peculiar feature of the G5-induced necrosis is an early and dramatic reorganization of the actin cytoskeleton, coupled to an alteration of cell adhesion. The importance of cell adhesion impairment in the G5-induced necrotic death of DKO cells was confirmed by the antagonist effect of the extracellular matrix-adhesive components, collagen and fibronectin.


Figures

FIGURE 1.
FIGURE 1.
Cell death in WT and DKO cells in response to G5 or bortezomib treatments. A, WT and DKO cells were treated with the indicated concentrations of G5 for 20 h, and the appearance of cell death was scored by trypan blue staining (means ± S.D., n = 3). B, WT and DKO cells were treated with the indicated concentrations of bortezomib for 20 h, and the appearance of cell death was scored by trypan blue staining (means ± S.D., n = 3). C, DEVDase activity in WT and DKO cells treated with the indicated concentrations of G5 for 20 h (means ± S.D., n = 3). D, DEVDase activity in WT and DKO cells treated with the indicated concentrations of bortezomib for 20 h (means ± S.D., n = 3). E, processing of caspase-3 and HDAC4 in WT and DKO cells treated with the indicated concentrations of G5 for 20 h. Equal amounts of cell lysates were subjected to SDS-PAGE electrophoresis. Immunoblots were performed using the indicated antibodies. Tubulin was used as loading control. F, WT cells were treated for 20 h with the indicated concentrations of G5 or with 50μm of etoposide, in the presence or absence of 100μm of the two pancaspase inhibitors Z-VAD-fmk (zVAD) and Z-VD-fmk (zVD). Cell death was scored by trypan blue staining (means ± S.D., n = 3). G, DKO cells were treated for 20 h with the indicated concentrations of G5 in the presence or absence of 100μm of the two pancaspase inhibitors Z-VAD-fmk and Z-VD-fmk. Cell death was scored by trypan blue staining (means ± S.D., n = 3). H, processing of caspase-3 and HDAC4 in DKO cells treated for 20 h with the indicated concentrations of G5, in the presence or absence of a 100 μm concentration of the two pancaspase inhibitors Z-VAD-fmk and Z-VD-fmk. Equal amounts of cell lysates were subjected to SDS-PAGE. Immunoblots were performed using the indicated antibodies. Tubulin was used as loading control.
FIGURE 2.
FIGURE 2.
G5 induced caspase activation in DKO cells depends on caspase-8. A, DKO cells expressing vesicular stomatitis virus-tagged crmA or Hygro (hygromycin resistance) genes treated with increasing concentrations of TNF-α (1, 10, or 80 ng/ml) and cycloheximide (CHX; 1 mg/ml), with cycloheximide alone (1 mg/ml) or left untreated. 36 h later, cell death was scored by trypan blue staining (means ± S.D., n = 3). B, DEVDase activity in DKO cells expressing vesicular stomatitis virus-tagged crmA or Hygro genes treated as in A (means ± S.D., n = 3). C, processing of PARP in DKO cells expressing Hygro or crmA genes and treated for 36 h with TNF-α (10 ng/ml). Equal amounts of cell lysates were subjected to SDS-PAGE. Immunoblots were performed using the indicated antibodies. Tubulin was used as a loading control. D, DKO cells expressing crmA or Hygro genes were treated for 20 h with the indicated concentrations of G5. Cell death was scored by trypan blue staining (means ± S.D., n = 3). E, processing of HDAC4 and caspase-3 in DKO cells expressing Hygro or crmA genes and treated for 20 h with the indicated concentrations of G5. Equal amounts of cell lysates were subjected to SDS-PAGE. Immunoblots were performed using the indicated antibodies. Tubulin was used as loading control. The asterisk indicates a unspecific band.
FIGURE 3.
FIGURE 3.
Autophagy in G5 and bortezomib treated cells. A, processing of LC3 in DKO and WT cells treated for 6 or 12 h with G5 (10 μm) or tamoxifen (12.5 μm). Equal amounts of cell lysates were subjected to SDS-PAGE. Immunoblots were performed using the indicated antibodies, and the LC3 conversion ratio was quantified by densitometric scanning of the Western blot shown. Tubulin was used as loading control. B, processing of LC3 in DKO and WT cells treated for 6 or 12 h with bortezomib (1 μm) or tamoxifen (12.5 μm). Equal amounts of cell lysates were subjected to SDS-PAGE. Immunoblots were performed using the indicated antibodies, and the LC3 conversion ratio was quantified by densitometric scanning of the Western blot shown. Tubulin was used as loading control. C, the electron micrograph shows the ultrastructure of multivesicular bodies (arrowhead) in DKO cells treated with 10 μm G5 for 12 h. D, electron micrograph at higher magnification showing multivesicular bodies in DKO cells treated with 10 μm G5 for 12 h. E, the electron micrograph at higher magnification showing detailed autophagosome structure in DKO cells treated with 10 μm G5 for 12 h. F, DKO cells were pretreated for 1 h with 3-methyladenine (3MA) (10 mm) or bafilomycin (0.1 μm) or left untreated (–). Next, G5 (10 μm), bortezomib (10 μm), or tamoxifen (12.5 μm) were added to the culture medium as indicated. 20 h later, cell death was scored by trypan blue staining (means ± S.D., n = 3).
FIGURE 4.
FIGURE 4.
Real time analysis of G5-induced cell death in WT cells. A, real time epifluorescence microscopy. Images were collected every 2 min after treatment of WT cells with 1.25μm G5. Representative images at the indicated times, differential interference contrast (upper panels) and ethidium bromide (lower panels), are shown. B, real time epifluorescence microscopy. Images were collected every 2 min after treatment of DKO cells with 10 μm G5. Representative images at the indicated times, differential interference contrast (upper panels) and ethidium bromide (lower panels), are shown.
FIGURE 5.
FIGURE 5.
Quantitative analysis of the time lapse studies. WT or DKO cells were treated with the indicated concentrations of bortezomib, G5, or etoposide and subjected to the time course analysis, as explained under “Materials and Methods.” The appearance of membrane blebbing, membrane blistering (cell swelling), and the uptake of ethidium bromide was scored in vivo. Each position along the x axis represents a single cell. ○, the appearance of membrane blebbing; ▵, membrane blister; ▪, ethidium bromide influx (EI).
FIGURE 6.
FIGURE 6.
G5-induced necrosis is characterized by HMGB1 release. A, DKO cells, grown on coverslips, were treated for 6 h with G5, as indicated. Immunofluorescences were performed, and epifluorescence microscopy followed by deconvolution analysis was used to visualize HMGB1 localization. Hoechst 33258 staining was applied to mark nuclei. B, quantitative analysis of the immunofluorescence studies exemplified in A. WT and DKO cells, grown on coverslips were treated for 6 h with G5 as indicated, and the cytosolic localization of HMGB1 was scored after immunofluorescence analysis. C, distribution of HMGB1 among subcellular fractions. WT and DKO cells were treated for 6 h with G5 as indicated. Crude nuclear and cytosolic fractions were obtained using detergent lysis, as described under “Materials and Methods.” Protein samples were prepared for Western blotting, and membranes were probed with the indicated antibodies. The transcription factor MEF2C and tubulin were used as controls for nuclear and cytosolic fractions. D, DKO cells were treated with methyl methanesulfonate (100 μg/ml) or G5 (10 μm), culture medium was collected 20 h later, and cells were lysed in SDS buffer. HMGB1 was detected by immunoblotting in both lysates and culture medium. Histones were visualized after Coomassie Blue staining. E, electron micrograph showing a WT cell in early necrosis after incubation with 10 μm G5. F, electron micrograph showing a DKO cell in early necrosis after incubation with 10 μm G5. G, electron micrograph showing a DKO cell in late necrosis after incubation with 10 μm of G5.
FIGURE 7.
FIGURE 7.
Mitochondrial depolarization induced by G5 in DKO cells. A, decrease of mitochondrial TMRM uptake in single WT cells as marker of ΔΨm. The ΔΨm was compared with the appearance of membrane blisters, a necrotic marker in cells treated with 5 μm G5. B, decrease of mitochondrial TMRM uptake in single DKO cells as marker of ΔΨm. The ΔΨm was compared with the appearance of membrane blisters, a necrotic marker in cells treated with 5 μm G5. C, decrease of mitochondrial TMRM uptake in single WT cells as a marker of ΔΨm. The ΔΨm was compared with the appearance of membrane blebbing, an apoptotic marker in cells treated with 25 nm bortezomib. Twenty typical WT or DKO cells from three independent experiments were analyzed. D, DKO cells were treated with G5 (10 μm) in the presence or absence of CsA (0.8 or 5 μm), and 12 h later, cell death was scored by trypan blue staining (means ± S.D., n = 3). E, WT and DKO cells were treated with rotenone (5 μm) or DMSO. 48 h later, cell death was scored by trypan blue staining (means ± S.D., n = 3).
FIGURE 8.
FIGURE 8.
Adhesion to the ECM counteracts G5-dependent necrosis. A, analysis of cell adhesion/spreading in cells treated with bortezomib or G5. Single images from the time lapse analysis of cells treated with G5 (10 μm) or bortezomib (10 μm) were subjected to morphological analysis. In G5-treated cells, the morphological analysis was performed before the appearance of necrosis (as marked by membrane blister and ethidium bromide influx staining) and within 20 h from the drug addition. Since bortezomib-treated cells do not show evident changes in cell shape, the morphological analysis was performed at 20 h from treatment. The cell spread area was quantified using MetaMorph. Results shown are pooled for 30 cells from three independent experiments. B, confocal pictures of DKO cells treated for 3 h with 10 μm G5 or bortezomib. Immunofluorescence analysis were performed to visualize HMGB1 subcellular localization. TRITC-phalloidin was used to decorate actin filaments. The arrows point to cells with evident alterations in cell morphology and adhesion but containing HMGB1 in the nucleus. The arrowheads point to cells with a cytoplasmic localization of HMGB1. C, quantitative analysis of stress fibers distribution in DKO cells treated as in B. 300 cells for each experiment were scored (means ± S.D., n = 3). D, time lapse images of a representative DKO cell treated with G5 (10 μm) and stained for enhanced yellow fluorescent protein-actin. The arrows indicate the disruption of actin filaments, and arrowheads show the uptake of ethidium bromide. The numbers indicate minutes from G5 addition. G and H, DKO cells expressing crmA or the relative control gene Hygro were grown on different ECM proteins, as indicated. 6 h after seeding, cells were incubated with G5 or 2,3-dimethoxy-1,4-naphthoquinone (DMNQ), as indicated. After 12 h, cell death was scored by trypan blue staining (means ± S.D., n = 3).

Similar articles

Cited by

References

    1. Ciechanover, A. (2005) Cell Death Differ. 12 1178–1190 - PubMed
    1. Hershko, A., and Ciechanover, A. (1998) Annu. Rev. Biochem. 67 425–479 - PubMed
    1. Amerik, A. Y., and Hochstrasser, M. (2004) Biochim. Biophys. Acta 1695 189–207 - PubMed
    1. Sun, L., and Chen, Z. J. (2004) Curr. Opin. Cell Biol. 16 119–126 - PubMed
    1. Brancolini, C. (2008) Curr. Mol. Pharm. 1 24–37 - PubMed

Publication types

MeSH terms

Substances